

UAF’s giant climate stripes boldly proclaim Arctic change
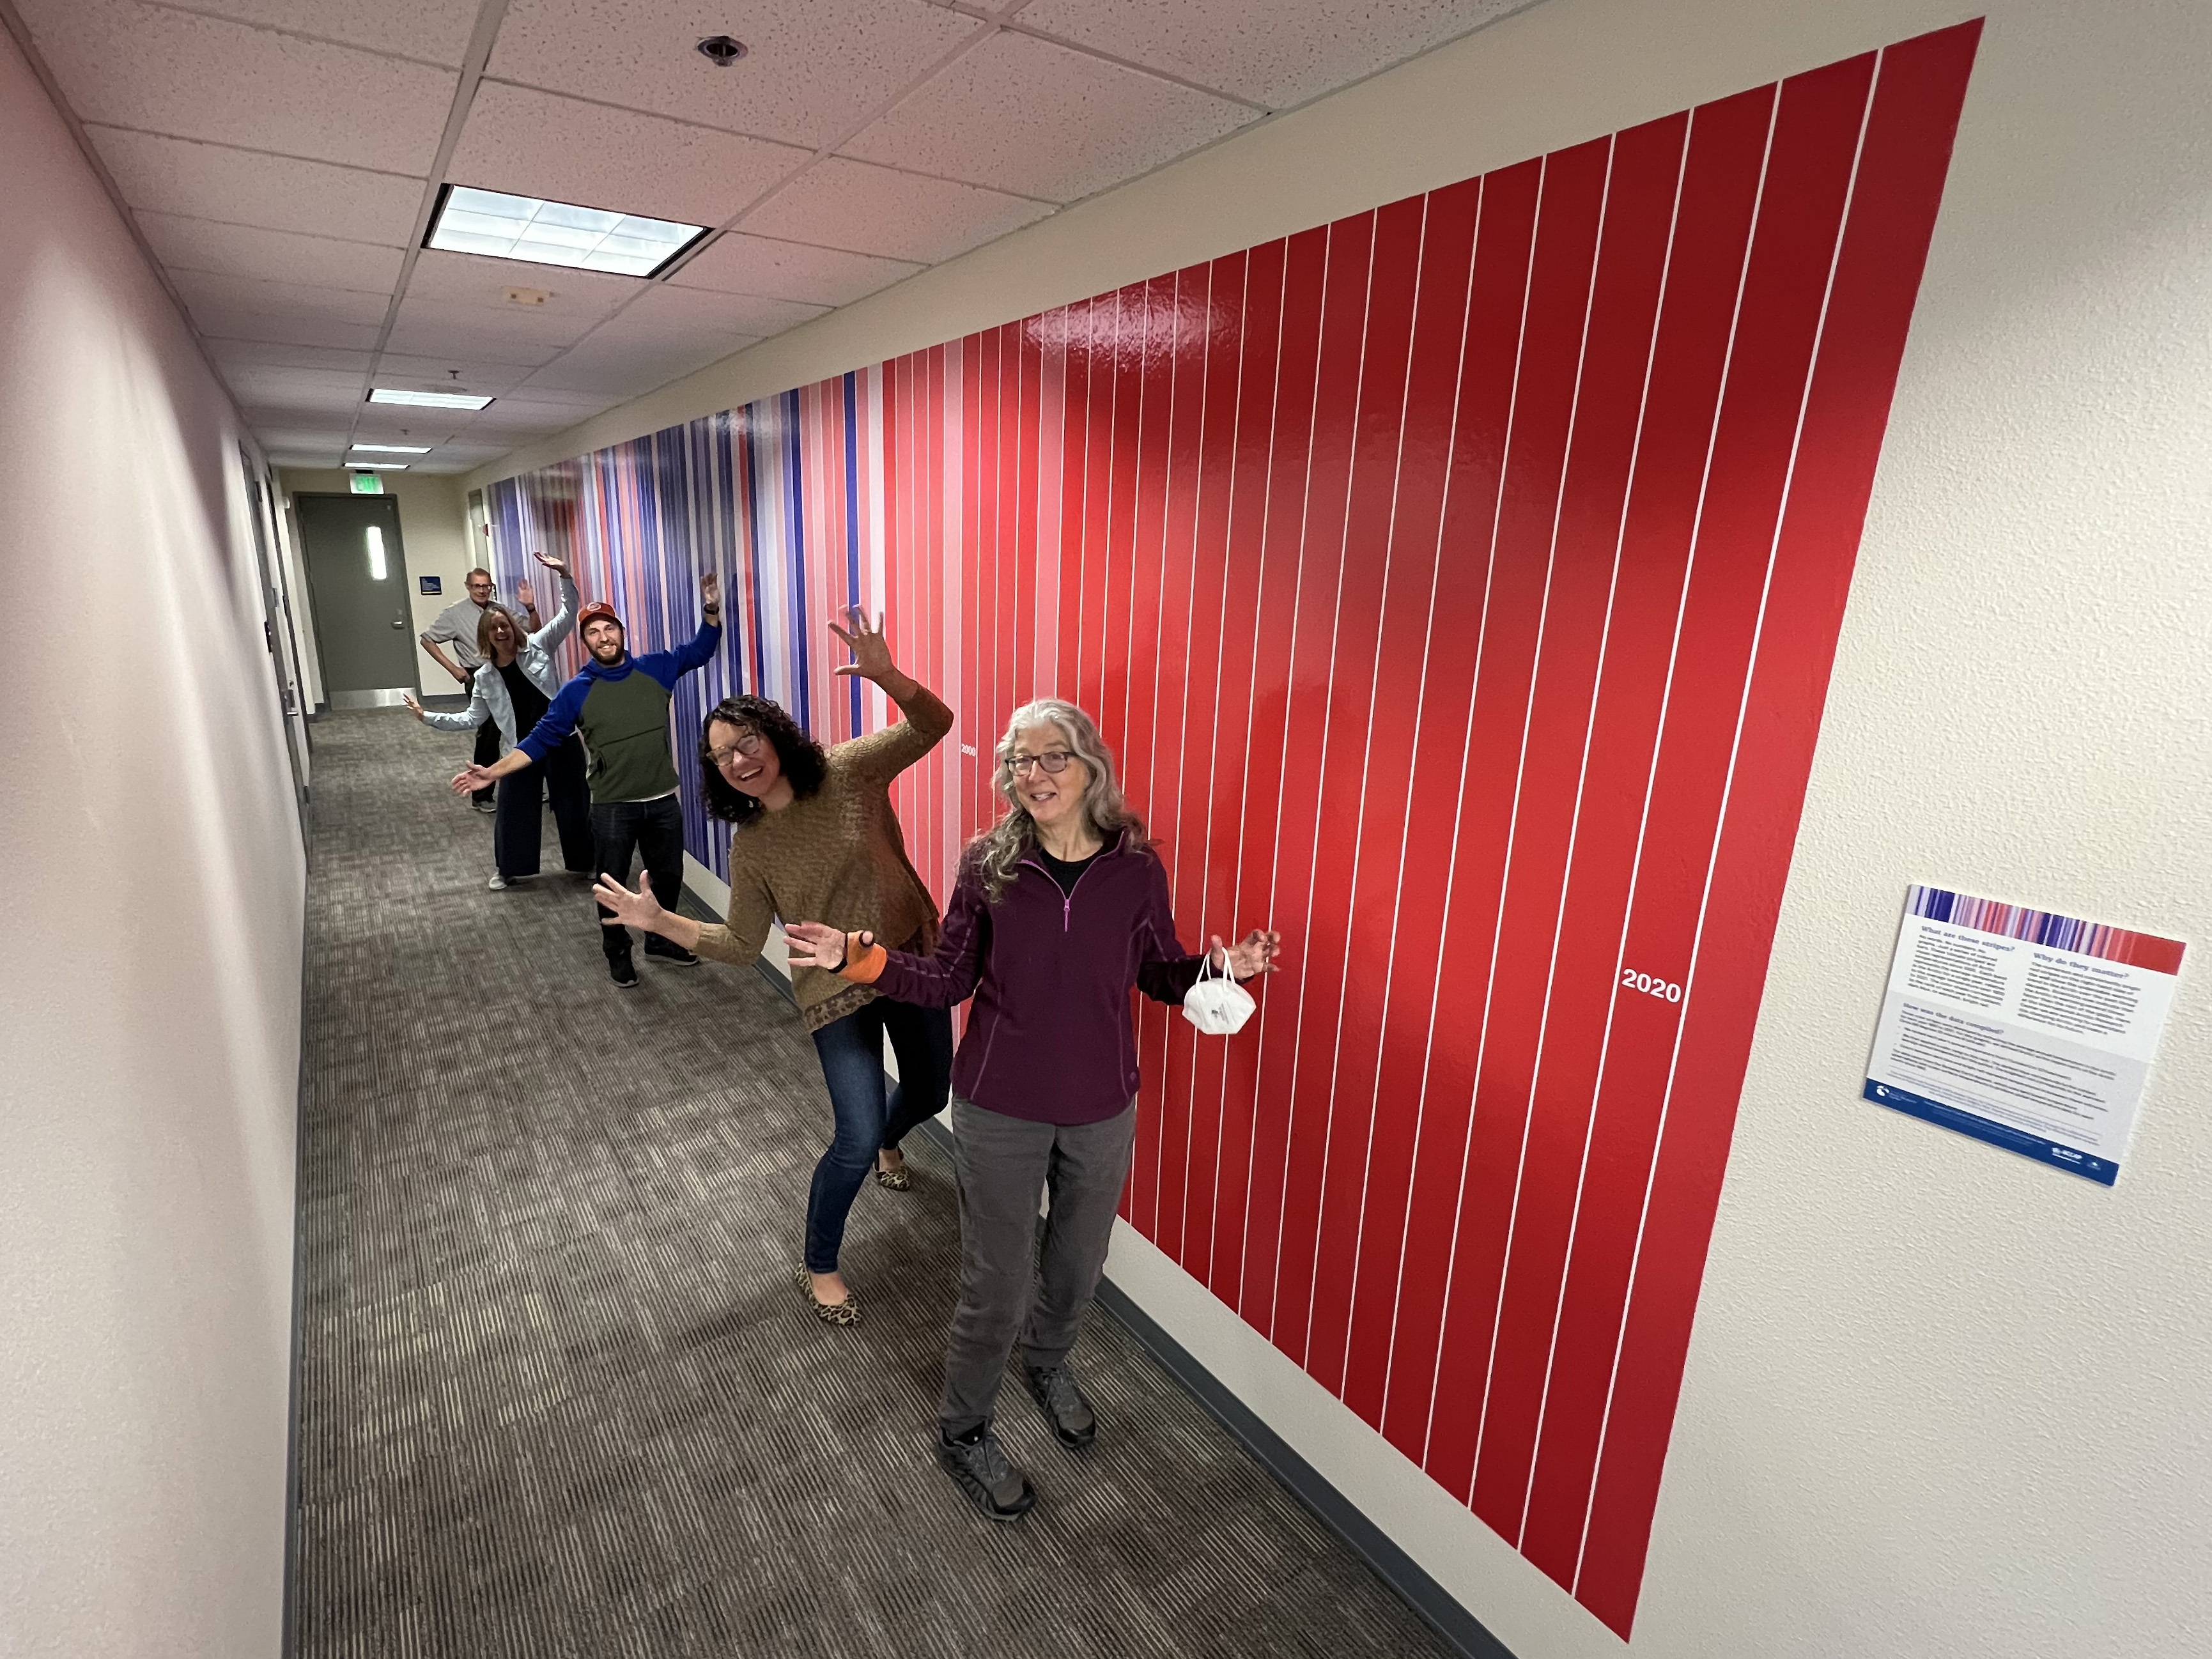
Scientists and staff at the International Arctic Research Center pose with the new climate stripes installation in UAF’s Akasofu Building showing temperature change in the Arctic since 1900.
Heather McFarland
907-474-6286
Jul. 27, 2022
The International Arctic Research Center is showing its stripes with a bold 40-foot-long hallway installation. The myriad of red and blue vertical bands makes a rainbow-like bar code representing Arctic temperatures from 1900 to 2021.
Bluer bands mean the temperature was cooler than the 1900-2021 average in a given year, while red means warmer than average. The color shade corresponds to the rank of each year, from the coldest to the warmest.
The trend in the Arctic is remarkable. Every year since 1992 shows red, meaning that annual temperatures have been above average for nearly three decades.
Such climate stripes, sometimes called warming stripes, have made a big splash internationally. They represent a movement to acknowledge climate change and work together to find solutions. In the past year, IARC has passed out nearly 1,600 climate-stripe stickers showing temperature data from communities like Utqiaġvik, Qikiqtaġruk (Kotzebue) and Fairbanks, all in Alaska, and Tromsø, Inuvik and Nuuk in other Arctic countries. People have found that the tool makes talking about climate change in the Arctic easier.
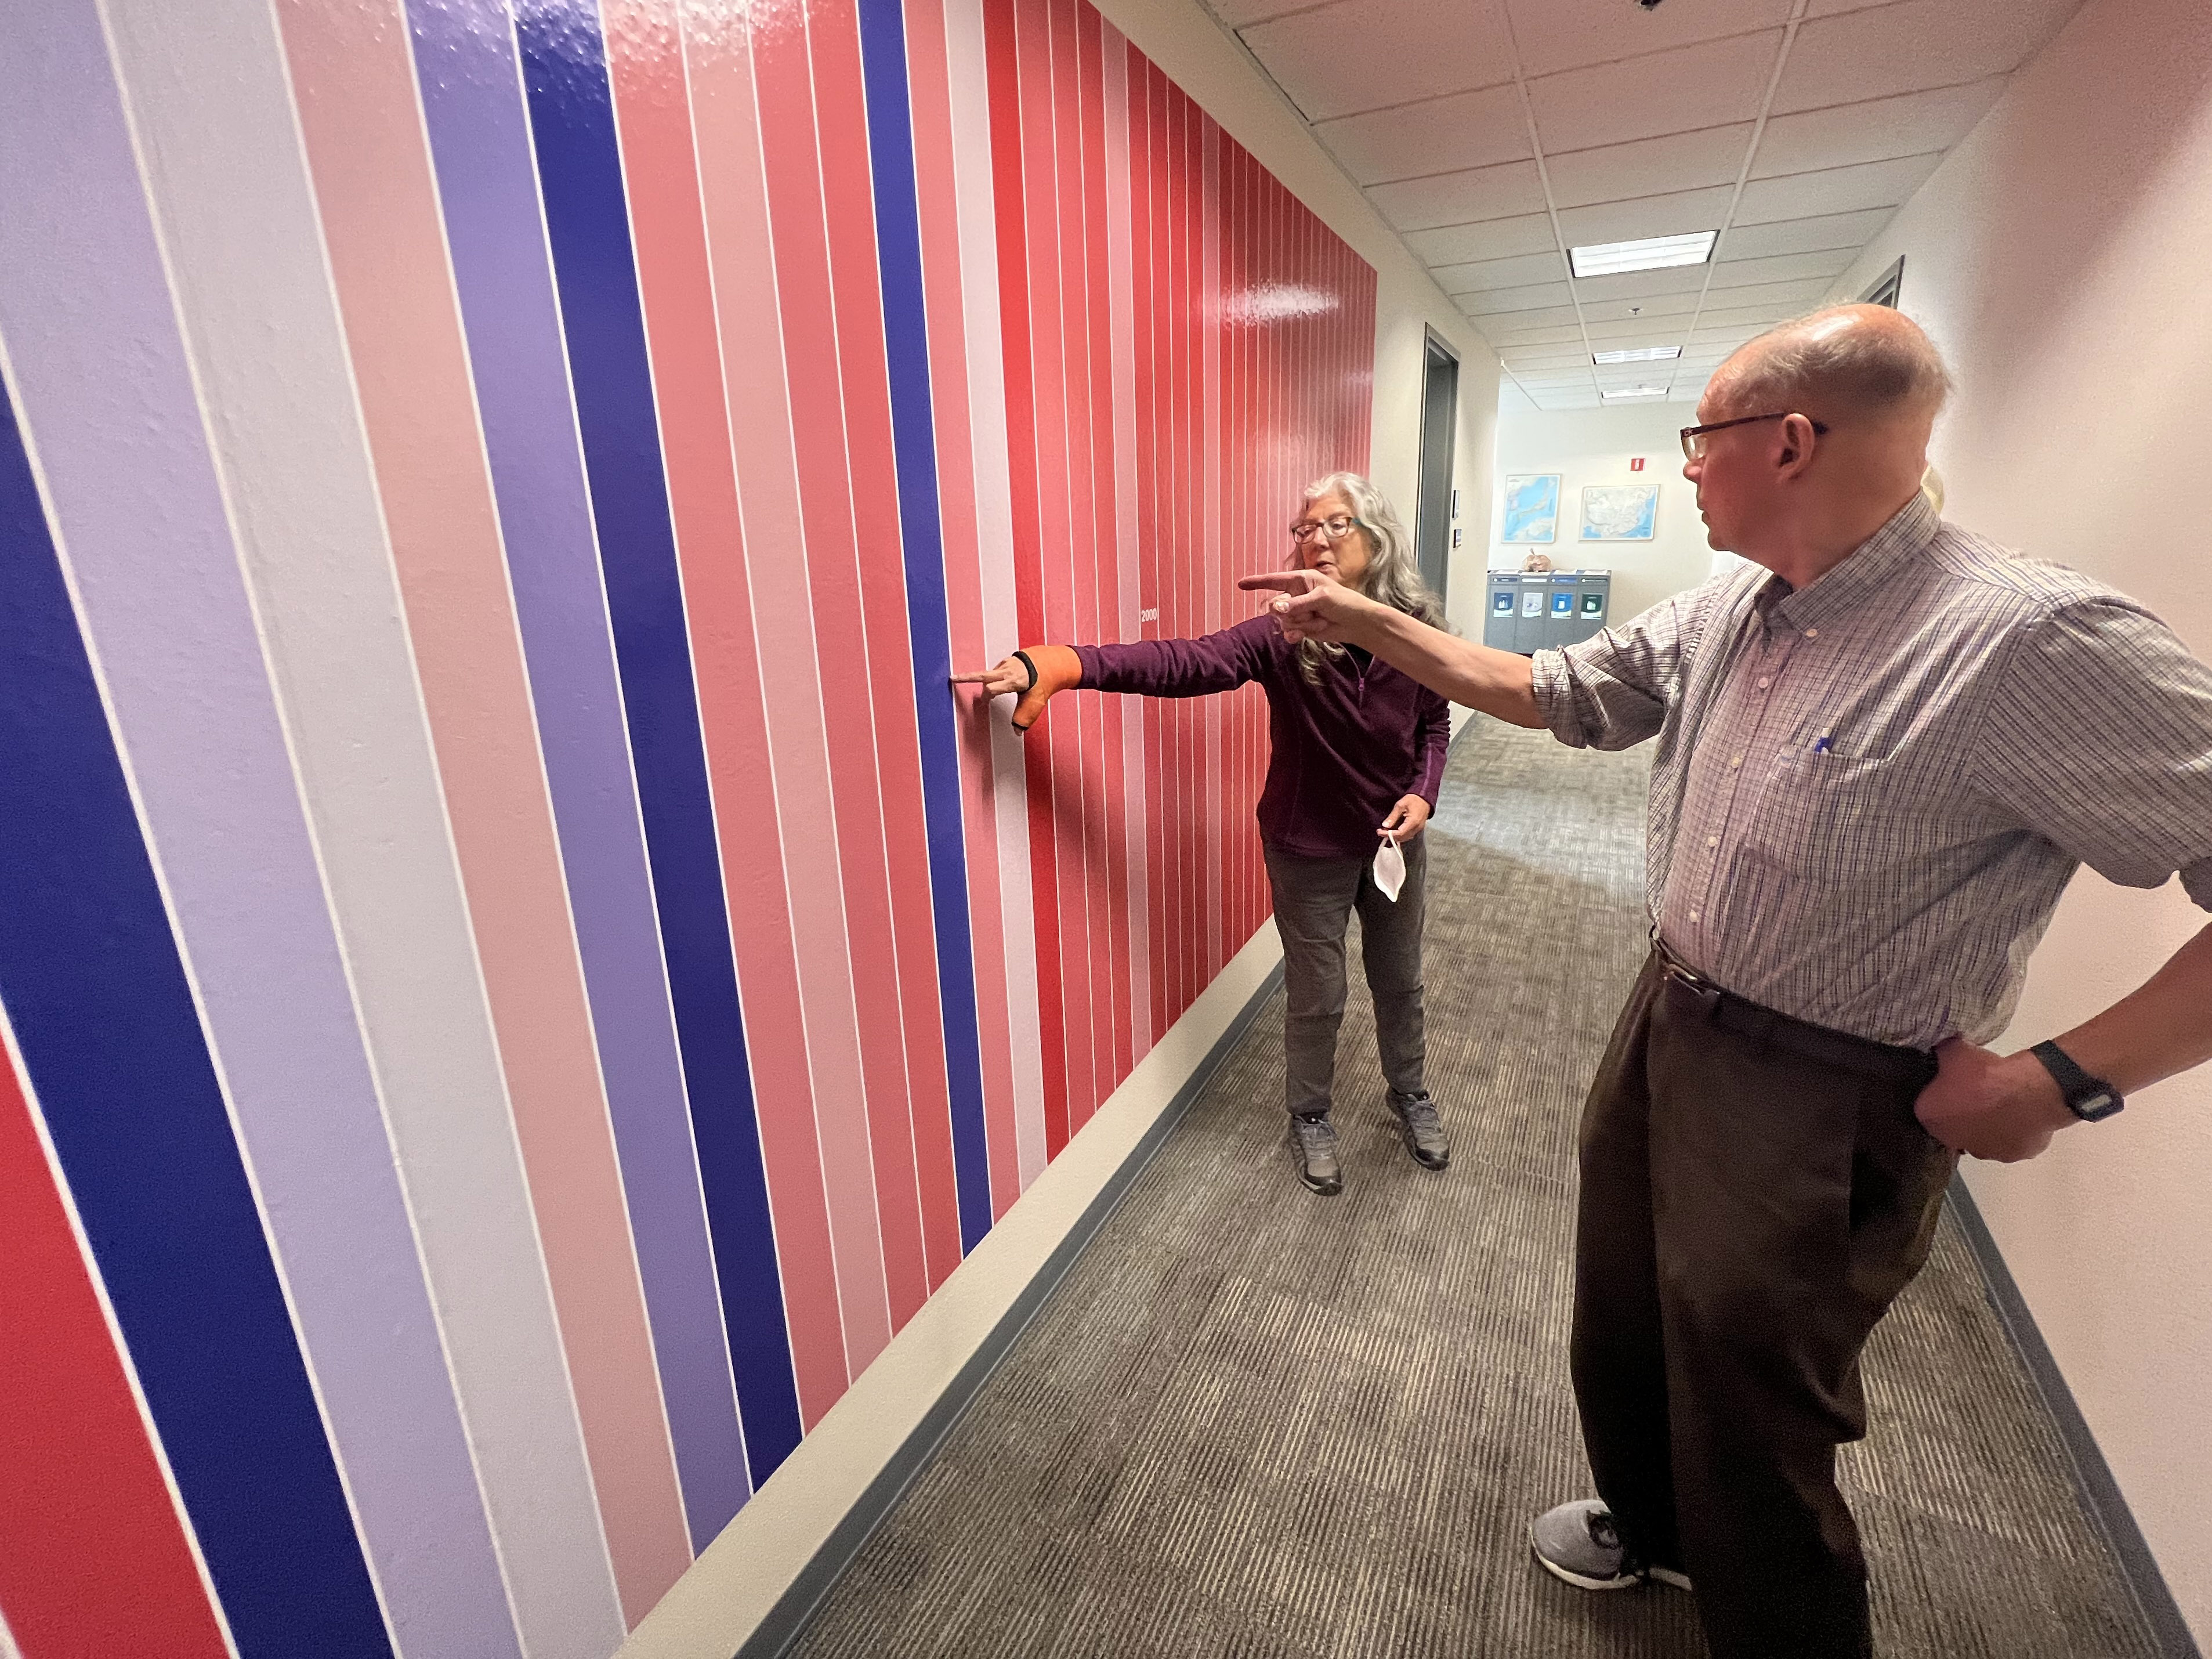
Alison York and John Walsh point out 1992, the last colder-than-average year in the Arctic, on the climate stripes wall.
Anyone is welcome to see the Arctic climate stripes at the home of the International Arctic Research Center on the fourth floor of the Akasofu Building at the University of Alaska Fairbanks. The building is open from 9 a.m. to 5 p.m. on weekdays. The center’s scientists hope visiting decision-makers, reporters, students and others will use the stripes to talk about the changing Arctic and be inspired to make a difference for its future.
IARC’s Alaska Center for Climate Assessment and Policy had the stripes installed using funds from the U.S. Department of Agriculture’s National Institute of Food and Agriculture. Alaska climate specialist Rick Thoman, with IARC, provided the data. Ed Hawkins at the University of Reading in England created the climate stripes concept.
021-23