

Map shows faster past ice movement in Greenland's interior
February 4, 2016
Sue Mitchell
907-474-5823
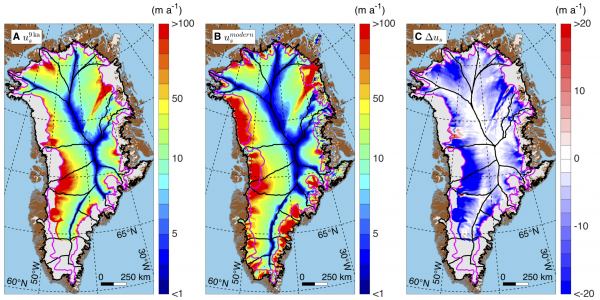
A University of Alaska Fairbanks researcher has helped create the first map that shows
how the Greenland Ice Sheet has moved over time.
The map helps scientists understand the history of the Greenland Ice Sheet, providing context for present-day rapid changes.
Mark Fahnestock, a UAF Geophysical Institute glaciologist, worked with Joe MacGregor, formerly of the University of Texas Institute for Geophysics, to understand what the layers of ice tell us about the flow of the ice sheet since the end of the last glacial period.
“Joe and I wondered whether the amount of ice in the ice sheet from the past 9,000 years fit with present measured rates of snowfall and ice flow,” Fahnestock said. “When we looked at this, it was clear there had been significant changes in the northwest and southern part of the ice sheet.”
The changes are being reported in the Feb. 5 edition of Science.
MacGregor, Fahnestock and others found that in the deep interior of the ice sheet, ice is currently moving more slowly toward the edges than it did 9,000 years ago. The finding does not contradict that current warming is causing rapid changes around the ice sheet’s outer edges and significantly contributing to sea level rise; however, changes in the interior have been thousands of years in the making.
One event that occurred in the Holocene period, the time since the end of the last ice age, was the collapse of the ice bridge between Greenland and nearby Ellesmere Island. Fahnestock said the collapse could tell scientists what changes to expect in current ice sheet conditions.
“Reconciling what the layering tells us about the past with what we know about present conditions gives us a better understanding of how the ice sheet works,” Fahnestock said.
ADDITIONAL CONTACTS: Mark Fahnestock 907-687-6371, fahnestock@gi.alaska.edu
ON THE WEB: University of Texas Institute for Geophysics: http://ig.utexas.edu/2016/02/04/scientists-map-movement-of-greenland-ice-over-last-9000-years/
Full text on Science: http://bit.ly/1X6E6Y8