

Taking a deep dive into Alaska’s record-breaking warm year
February 5, 2020
Heather McFarland
907-474-6286
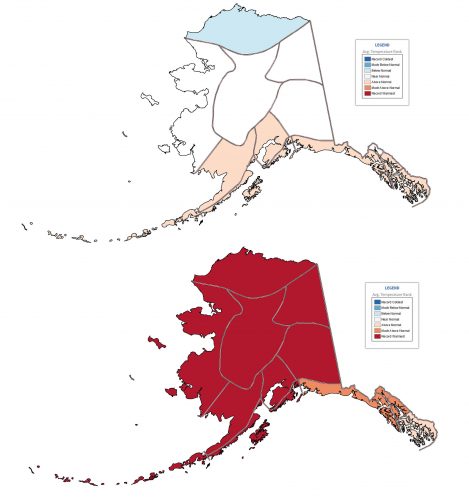
Alaska had its warmest year on record in 2019, making a big splash across state, national and even world news. That ranking would not be possible without the diligent and forward-looking work of a handful of University of Alaska Fairbanks scientists.
Each month the National Oceanic and Atmospheric Administration assesses the U.S. climate by examining long-term temperature and precipitation trends. The agency produces annual climate rankings and other products only for states that have been subdivided into official climate divisions. Until 2015, Alaska was not one of them.
The Lower 48 states created their climate divisions in the early 1950s, in many cases by hand drawing boundaries based on county lines or intuition. Now, NOAA has rigorous procedures that ensure the divisions are determined by statistics and objective climate data.
The goal is for climate variables in the same division to have the same kinds of patterns, explained Uma Bhatt, a climate scientist at the UAF Geophysical Institute. “Temperatures in a specific division vary in a similar way, they go up together and they go down together,” she said.
Bhatt and Rick Thoman, who was with NOAA’s National Weather Service at the time, championed the creation of Alaska’s climate divisions. Peter Bieniek, then a graduate student and now a climate scientist at the UAF International Arctic Research Center, led the effort.
To define the boundaries of each division, Bieniek examined weather station data from 1977-2009, looking for clusters of locations with similar climate patterns. After using statistics to lump stations, he turned to National Weather Service offices and forecast centers across Alaska for fine tuning.
“We knew roughly the clusters, but where do you draw the lines?” asked Bieniek.
The team received substantial pushback from science reviewers over the use of “local expert knowledge,” something Bieniek felt was critical considering the sparsity of data in some areas of the state.
The weather experts’ role was particularly important in Southeast Alaska. For example, NWS Juneau forecaster Frederick Fritsch provided input that ultimately redefined the division Skagway belonged to. The community was influenced by weather patterns much different than the coastal area surrounding it.
“The collaborative process that Peter went through and Uma encouraged, in the end resulted in an infinitely better product,” said Thoman, who is now a climate specialist at the UAF Alaska Center for Climate Assessment and Policy.

Getting NOAA to recognize the 13 climate divisions Bieniek and his team identified was not an easy bureaucratic lift. It took 15 university climate scientists and NOAA collaborators over six years before the climate divisions and associated data were accepted and made publicly available on NOAA’s website.
Had the 2019 warm year occurred prior to 2015, scientists would not have been able to place it in the context of the long-term climate trend. “That’s what struck me when I heard that story,” said Bhatt. “I thought holy crap this wouldn’t even be in NOAA report if it weren’t for the climate divisions.”
“User-inspired science is never easy, but when it pays off it can pay off in big ways,” Thoman said.
Since Alaska is not a unified entity, the climate divisions also help place regional trends and extreme events into historical context. In Southeast Alaska, the divisions were critical for understanding the severity of the recent drought.
“Prior to these climate divisions, a regional statement like, ‘For southern Southeast the average precipitation this month was 10 inches, and that is only 60% of the normal,’ would have been impossible to say,” explained Thoman. “The best we could do, is say, for example, at Ketchikan the precipitation was 7 inches.”
The climate divisions illustrate a reality that many Alaskans know well: If you want something in Alaska, sometimes you have to do it yourself.