Using microwaves to see through clouds
August 3, 2017
Sue Mitchell
907-474-5823

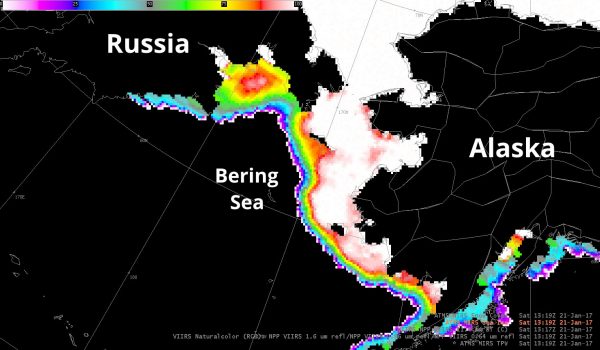
The most common types of satellite images are only able to see the “top” of the sky — if it is a cloudy day, the satellite will only be able to see the tops of the clouds. For weather forecasters studying sea ice, this can be a large problem.
“Consider if you were riding a satellite looking down at Alaska in the springtime,” said Eric Stevens, a science liaison at the Geographic Information Network of Alaska, a University of Alaska program that shares the institution's mapping expertise and data. “The clouds are white, the snow-covered ground is white, the sea ice is white. Everything is white. How can you tell these things apart?”
One solution is to create images using longer wavelengths of light, which the satellites can detect but human eyes cannot. This usually means infrared light, which has a slightly longer wavelength than visible light; however, recently GINA has been able to provide images in the microwave spectrum, which has a significantly longer wavelength than visible light.
These microwave images allow forecasters to “see through clouds” — instead of only seeing the top of a cloud, microwaves images can show inside the cloud and what is below the cloud, according to Carl Dierking, a satellite data liaison for GINA. Satellites are able to take these images even in the dark, because they are picking up microwaves that are emitted by the Earth itself.
“Satellite imagery is the main way that we can see the sea ice in a broad view but still get details,” said Mary-Beth Schreck, a National Weather Service sea ice analyst working on the Alaska Sea Ice Program.
GINA sends the weather service a number of image types, each with different information.
“Each type of image has their strengths and weaknesses, so we use each one throughout the year at different times,” Schreck said.
Infrared, which can show heat, and the day/night band, which is extremely sensitive to light, are useful during the winter since it is often dark. Visible light is useful during the summer and on days with few clouds, because it can be difficult to distinguish between clouds, snow and ice.
Several of these issues are also solved by microwave imagery, and, while it is still a developing technology, GINA is able to provide this information to the National Weather Service in near real time.
One of the Alaska Sea Ice Program’s biggest duties is the daily sea ice analysis. The program staff gather all of the satellite imagery of Alaska waters they can to make accurate maps of the ice, Schreck said.
When someone needs to know about ice conditions, the analysts can tell that person if there are smaller floes or if there is a clear path in a certain direction. They also look at what direction the ice has been moving, what the ocean temperature is — if the ice will freeze or melt — or if wind will actively move the ice.
Stevens said the mission of the National Weather Service is “to protect lives and property,” and he believes the Alaska Sea Ice Program is a great example of that.
“There are many links in the chain to achieve that goal, and GINA plays a role in providing one of those links by giving tools and resources to the weather service.”
ADDITIONAL CONTACT: Carl Dierking, cfdierking@alaska.edu
This article was written by Josh Hartman, a student assistant in the UAF Geophysical Institute's public information office.


