

UAF helps develop air quality data for popular Alaska wildfire website
Rod Boyce
907-474-7185
Sept. 11, 2023
Getting information about where wildfire smoke is headed in Alaska has become easy for the public, thanks to collaboration between the University of Alaska Fairbanks and the Alaska Fire Service.
UAF researchers and data experts have worked with the Alaska Fire Service to add air quality information to the agency’s popular map and data website.
To find the air quality information, users can go to the Alaska Wildland Fire Information Map online and click on the “Fuels and current conditions” tab. Air quality forecasts can be placed by selecting that layer in the “Current conditions” list on the page’s right. Click on the small triangles for forecast times and a map color legend.

The Pogo Mine Road Fire burns on Saturday, Aug. 5, 2023.
Wildfire smoke is often prevalent around Interior Alaska during summer, making quick access to air quality information, including projections, especially helpful.
“We started the conversation about two years ago to figure out how to get air quality information on their website,” UAF Geophysical Institute associate professor Jingqiu Mao said. Mao teaches in the UAF Department of Chemistry and Biochemistry and is also a member of NASA's Health and Air Quality Science Team.
The challenge, Mao said, is that air quality data is in computer modeling form and could not be directly used on the Alaska Fire Service website. Extensive work was done at the Geographic Information Network of Alaska, a unit of the Geophysical Institute, to make the data compatible with the Alaska Fire Service website.
“We had to do a lot of data conversions and make sure those conversions could work,” Mao said.
The Alaska Fire Service, an agency of the U.S. Bureau of Land Management, provided feedback to UAF researchers and steered them to GINA, which has a track record of providing data compatible with the Alaska Wildland Fire Information Map.
“As someone who is always looking to improve ways to communicate with public in a timely manner, adding this information to the widely used Alaska Wildland Fire Information Map Series is very beneficial,” said public affairs specialist Beth Ipsen, who coordinates getting timely and accurate wildfire related information to the public for the Alaska Fire Service.
“Adding this to the interactive map saves time, which is of the essence during emergency incidents and changing situations,” she said. “And it empowers people to find air quality information specific to their location.”
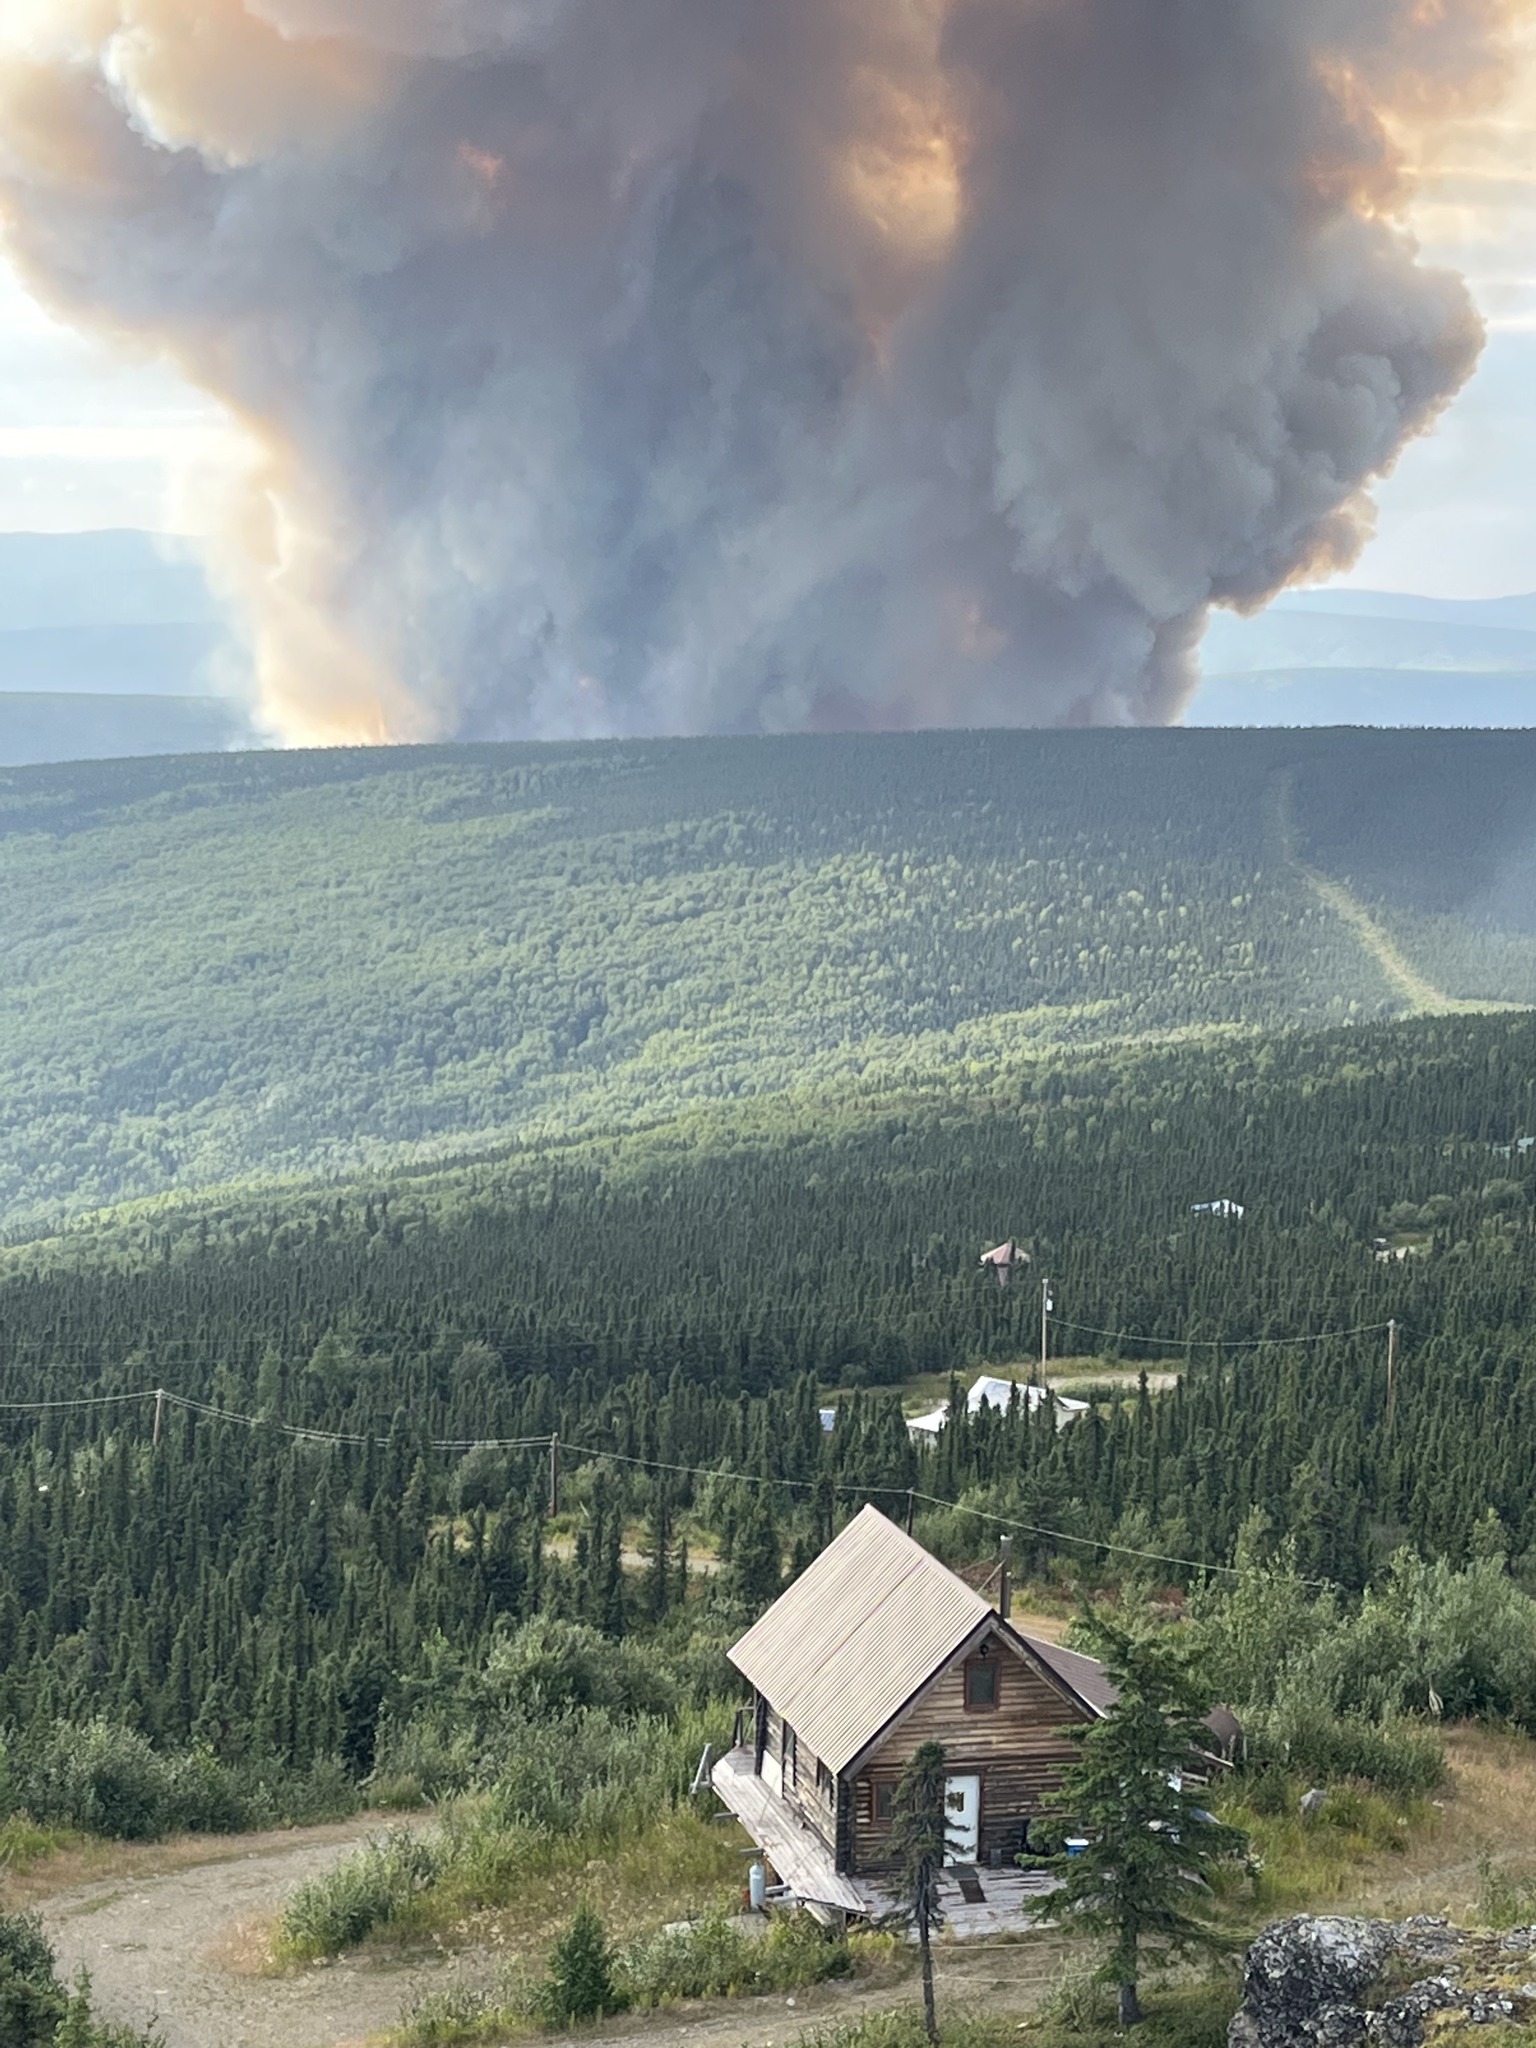
The Lost Horse Creek Fire smoke column rises north of Fairbanks in early August 2023.
In the approach developed by Mao and his doctoral student, Zhiwei Dong, air quality data is acquired daily from NASA’s Global Modeling and Assimilation Office and used to model air quality forecasts for six-hour periods over two days. The data are for all particulate matter from all sources, but wildfires are the primary contributor during Alaska summers.
GINA processes these files and makes them available to display on the Alaska Fire Service website.
“This summer, GINA began using satellite data in near real-time to look at the presence of smoke in the total atmospheric column using a visible and infrared imaging instrument aboard two satellites,” GINA Director Jennifer Delamere said. “These calculations performed at GINA are done every time there is a satellite overpass during daylight hours.”
Delamere said work continues on improving the air quality component. She said the GINA team has begun creating air quality products in near real-time.
“We are just in the initial process of analyzing these products over Alaska,” she said. “With Jingqiu’s modeling efforts and with GINA-generated satellite data, we can build out a larger portfolio of air quality products to share with the community.”
GINA staff use satellite measurements of visible, infrared and microwave radiation from Earth to produce maps and imagery of temperature, humidity, precipitation and a variety of specialized visualizations.
GINA continually receives data through antennas at the federal government’s Fairbanks Command and Data Acquisition Station at Gilmore Creek, 12.5 miles northeast of UAF, and atop the Akasofu Building on UAF’s Troth Yeddha' Campus in Fairbanks.
ADDITIONAL CONTACT: Jingqiu Mao, jmao2@alaska.edu