A Solar Design Manual for Alaska, Sixth Edition
EEM-01255 View this publication in PDF form to print or download.

Art Nash, Extension Energy Specialist, and Chris Pike, Alaska Center for Energy and Power. Originally written by Rich Seifert, former Extension Energy Specialist.
Revised October 2022
Table of Contents
- Acknowledgements
- Foreword
- Introduction
- Photovoltaic Systems
- How Solar PV Works
- Assessing the Solar Resource and Planning the System Layout
- Solar PV Modeling Best Practices
- Publicly Available Solar Resource Datasets
- Basic Solar PV System Components
- Current Standards and Codes
- Net Metering and Interconnection
- Solar PV Economics and Financing
- Grid Connected Solar PV in Rural Alaska
- Off-Grid Solar Systems
- References
- Solar Thermal Systems
- Appendix A: Passive Solar Heating: An Energy Factsheet
- Appendix B: Solar Greenhouses
- Appendix C: Do-It-Yourself Solar
- Appendix D: F-Charts
- Appendix E: Glossary
Acknowledgements
This is the 6th edition of “A Solar Manual for Alaska,” which was first published by Richard Seifert in 1981. In this edition, we’ve significantly expanded the space that is devoted to solar photovoltaics (PV). Solar PV has experienced a dramatic drop in pricing over the past decade, and interest among a variety of stakeholders in the state has grown significantly. We have been fortunate to draw on the experiences of many people throughout Alaska who have installed and lived with PV systems in a variety of situations.
First, I want to acknowledge the UAF Cooperative Extension Outreach and Communications team staff who have been incredibly supportive and helpful during the whole process of rewriting and laying out this edition of “A Solar Manual for Alaska.”
Installers Ben May and Stephen Trimble along with Cady Lister from the Alaska Energy Authority provided the information for the economics and financing section. Jill Fredston and Doug Fester were kind enough to share detailed production data and cost information for their grid-tied roof-top PV system. Julie Estey and Thomas Van Thiel from Matanuska Electric Association, Ben Beste from Alaska Power and Telephone, and Bill Stamm from Alaska Village Electric Cooperative have been kind enough to answer my never-ending questions and contribute the important utility perspectives on distributed solar generation. Art Nash, energy specialist with the UAF Cooperative Extension Service, wrote Appendix A, Passive Solar Heating and Appendix B, Solar Greenhouses. Sam Dennis put together the DIY Solar PV section, which is found in Appendix C. And finally, the following individuals were kind enough to review proposed outlines and give suggestions on ways to improve this publication: Tom Marsik, Cold Climate Housing Research Center; Tony SlatonBarker, Coffman Engineers; Tran Smyth; Dave Pelunis-Messier, Tanana Chiefs Conference; Mark Houston, The Comforts of Home; Mark Haller and Eddie Davidson, Renewable Energy Systems; Ingemar Mathiasson, Northwest Arctic Bureau; Rob Bensin, Bering Straits Development Corporation; Alan Mitchell, Analysis North; and David Nicol, Capstone Solutions; Klaus Dohring and Ian Flood, who delivered a presentation to the Arctic Remote Energy Networks Academy on the Colville Lake solar-diesel system that was used in this manual; Mark Masteller, UAF Bristol Bay Campus; and Erin Whitney, Daisy Huang, and the entire ACEP staff. Personnel support for this manual was funded by Office of Naval Research through the Alaska Hub for Energy Innovation and Development by award number N00014-17-1-2673.
And finally, a special thanks to Rich Seifert, professor emeritus at the University of Alaska Fairbanks for having the foresight to initially publish this manual in 1981 and to push the envelope of solar and building science in Alaska.
— Chris Pike, Research Engineer, ACEP
![]()


Foreword
It’s been eight years since the last edition of “A Solar Manual for Alaska” was published by Rich Seifert and the UAF Cooperative Extension Service. Since that time, Rich has moved to a professor emeritas role, and solar PV technology has changed a lot. It’s an exciting time for solar power in Alaska. Previous attention was on passive solar and solar thermal, which continue to be reliable, established and mature technologies. In the past, however, solar PV was largely relegated to off-grid use because of the challenging economics. Low capacity factors, clunky technology and high prices made grid-tied applications rare in Alaska. Now, however, the price of solar PV continues to drop and in some situations has reached parity with power produced from fossil fuels. Solar PV modules continue to improve, and efficiencies above 20% are becoming common for commercially available panels. Inverter technology has largely become plug and play, and monitoring is becoming standard. All this makes for quicker installs and reduction in labor costs.
Alaska’s high latitude presents the challenge of having minimal solar energy during long winter months, when energy demand is greatest. At the same time, solar generation in the shoulder months (spring and fall) is often impressive in northern latitudes, where clear skies, cool temperatures, dry air, and bright, reflective snow all support solar generation. Solar PV systems can actually exceed their rated output during these times of year.
On the railbelt, the financial rewards for a solar installation can meet or exceed the rewards a person could expect from other typical investment portfolios. In Alaska, three significant factors continue to impact the growing adoption of solar PV:
- Net metering and grid-tie technology that eliminate the need for storage
- A dramatic 80% drop in solar panel prices since about 2010
- A 30% tax credit subtracted from your federal tax bill
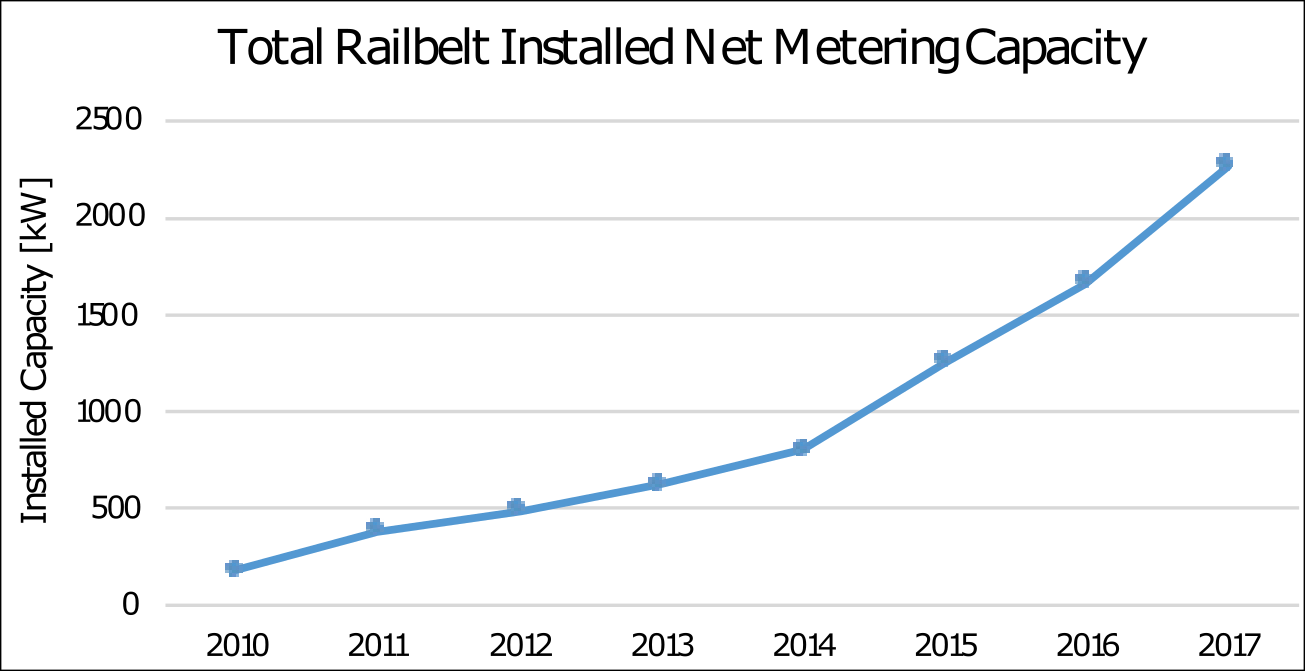
Net metering was instituted in Alaska for qualifying utilities in 2010 and since that time the installed capacity of net metered solar PV has risen from 200 kW to almost 2.5 MW on the railbelt alone. Most of that added capacity has been installed in the last four years. Nationwide, the amount of solar generation capacity for homes, businesses, and organizations grew from 585 MW in 2010 to 4,247 MW in 2016, according to the Solar Energy Industries Association and GTM Research. In Alaska, several hundred kW of solar PV have been installed off the railbelt, although these numbers are harder to track with as much detail. In addition, as of the summer of 2018, there are two different railbelt utilities planning on installing utility-owned PV systems that will be greater than 500 kW each, and in rural Alaska there are many more systems.
The coming years will be even more exciting. Improvements in energy storage technology along with falling prices and improved power electronics and software will allow power to flow in a more decentralized manner. Distributed renewable energy production will continue to play an expanding role in the energy distribution infrastructure.
The last edition of this manual covered passive solar, solar PV, and solar thermal. After consultation with the original author and in an attempt to limit the size and scope of the manual, the passive solar section has been eliminated, although many parts of this section have been integrated into other sections. We continue to stress that the most important thing to do before installing any kind of solar system on your home or business is to search for the ways to improve the energy efficiency of your home. “Efficiency first” is something you will see repeated often throughout this manual — efficiency improvements will nearly always have the quickest economic payback.
This manual is not intended to be a full manual to teach people how to build their own solar system. Still, several people have contributed some of their own experiences building PV systems and these are included in the appendix section. While most parts of this manual are aimed at homeowners and small businesses that are trying to learn more about installing solar, some examples of utility-owned PV are also included.
In the past, solar thermal was the cheaper of the solar options, but this has flip-flopped over the last decade. While solar thermal controls have improved, the actual heat collection technology hasn’t changed at the same pace as its electric-producing counterpart. The original solar thermal section is included in this manual and we encourage people to consider the pros and cons of solar PV versus solar thermal and the appropriate payoffs and decide for themselves which is best for their application.
Solar PV has transitioned from a technology largely associated with off-grid cabins to one associated with investors in suits. Cheaper prices have brought solar into the mainstream, and the associated job growth and investment in the industry have created opportunities for continued economic growth. Alaska is just beginning to experience this.
Introduction
This manual is an attempt to assemble Alaska-specific solar energy design information in a single volume. The manual is organized according to several major subject areas.
The first section is an introductory background discussion of solar energy and some of the important physical concepts necessary to understand it. This is followed by a discussion of Alaska-specific considerations regarding solar energy.
The next major section covers solar photovoltaic (PV) technologies. In the previous addition of this manual it was described as a major emerging option. It is now a robust and mature technology that is widely used in grid-tied and off-grid applications around the world. This section attempts to educate readers about the parts of typical systems, common misperceptions, and important items to remember when considering solar PV for your home or business.
A third section describes the heating of domestic or commercial hot water using solar energy. This section discusses factors such as the solar geometry at high latitudes, shading, and snow cover effects, all of which influence the performance of solar hot water heating systems. Solar thermal technology has not undergone as many changes since the last edition as solar PV, and much of this section remains unchanged.
A Short Course in Solar Energy
The sun is a virtually limitless source of energy. It has been burning for about 5 billion years and will burn for approximately 5 billion more — virtually forever on the human scale. Solar energy is radiation. Most early solar technologies captured this radiation as heat, but as the use of solar photovoltaics has become more widespread, technologies that convert solar energy directly to electrical energy are now commonplace.
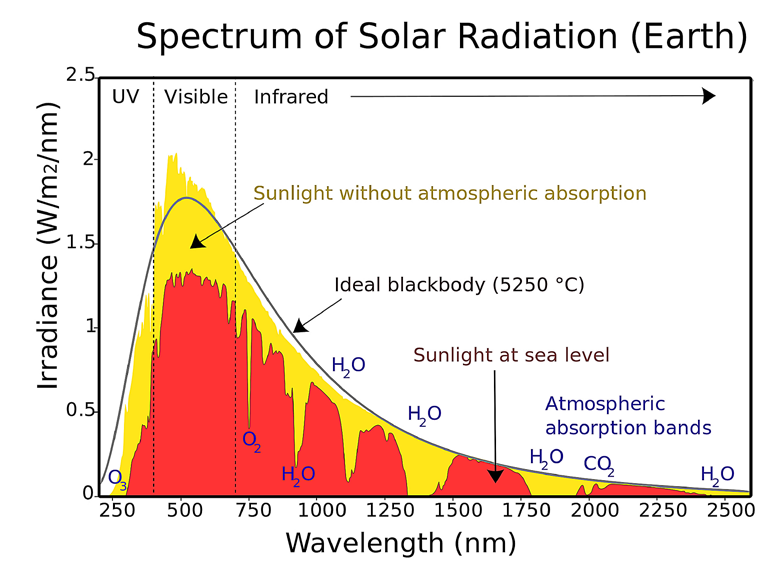
The solar radiation spectrum is composed of UV infrared radiation, visible light, and ultraviolet light. Visible light is the largest component of solar radiation. Wavelengths shorter than visible light (called ultraviolet) are largely absorbed in the upper atmosphere. The other major component of solar radiation, infrared, has longer wavelengths than visible light. We perceive infrared radiation as heat. A hot object emits infrared radiation, allowing us to sense the object without touching it. Over 90% of the solar radiation reaching the Earth’s atmosphere is visible light and near-infrared radiation, while ultraviolet (UV) light makes up less than 10% of solar radiation. Figure 1 illustrates the solar spectrum.
The amount of available solar radiation is not constant. Solar altitude, the height of the sun above the horizon at midday, and day length vary with the season. Light intensity changes with the time of day. Environmental conditions further modify the amount of solar energy that the surface of the earth receives at a particular location or time. Yet the sun does emit a relatively constant amount of radiation with time. Referred to as the solar constant, the amount of solar radiation at the outside of the atmosphere facing the sun is about 1,350 watts/m2, equivalent to 428 Btu/ft2/hr. A Btu (British thermal unit) is the amount of heat needed to raise the temperature of a pound of water by 1°F.
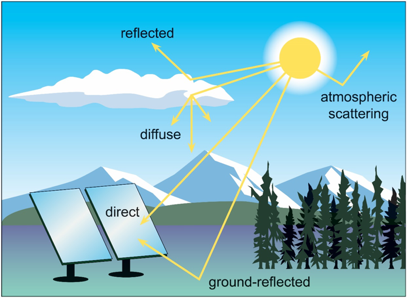
As solar radiation passes through the atmosphere, some continues in a straight path and some is scattered by the atmosphere. The former is called beam, or direct, radiation and the latter is called diffuse radiation. Beam radiation enables shadows to be cast, and diffuse radiation is characteristic of overcast days. Diffuse radiation comes from all directions in the sky, so it cannot be focused. It is still useful to those solar systems that don’t require focusing of the solar radiation. A third type of radiation that is important in Alaska is often referred to as reflected radiation, radiation that is reflected off the ground before it reaches the aperture plane of the collector (Horta et al., 2008). Solar radiation received on a surface is usually a combination of all three of these components (Figure 2).
Irradiance
Irradiance is the term used to describe the total amount of solar radiation energy received on the surface, measured in Watts/meter2 (W/ m2 ). Depending on many factors, including weather and atmospheric scattering, different locations receive different proportions of direct and diffuse radiation. Typically, dry desert conditions receive the highest proportion of direct radiation. Insolation describes irradiance over time. For example, if a location is receiving 1,000 W/m2 for one hour, then the insolation received is 1 kWh/m2.
Peak Sun Hours
Many solar professionals describe the solar resource in a particular area as the number of peak sun hours (or simply sun hours) that a region experiences. 1,000 W/m2 is generally accepted as the maximum irradiance level that is achieved at the surface of the Earth. In reality, irradiance levels can be higher in certain clear, dry conditions and at high elevations. In Alaska, there are time periods in the spring when clear, cold conditions occur along with highly reflective white snow cover snow, which allows irradiance levels to exceed 1,000 W/m2. Peak sun hours refers to the solar energy which a particular location would receive if the sun were shining at its maximum value for a certain number of hours. To calculate peak sun hours divide 1,000 W/m2 into the total insolation for a day. If total insolation for the day was 5,000 Wh/m2, then one could say that there were five sun hours on that day. Understanding this terminology and the concept of peak sun hours can be helpful when learning about solar energy. Some irradiance maps also express the irradiance by the average daily sun hours on an annual and monthly basis. We will use this terminology throughout this guide.
Solar Energy in Alaska
The potential for using solar energy in Alaska has long suffered from the notion that the sun simply doesn’t offer any hope for Alaskans. Alaska is not Arizona, and it is true that from roughly November 15 until the end of January, little solar radiation is available, and optimizing a system to collect it is not economically feasible. So, what can the sun provide?
Despite long, dark winters, northern latitudes actually receive some bonus daylight because of the long sunrises and sunsets. There are 230 hours more of possible sunlight at the Arctic Circle than at the equator (Hartman et al., 1978), but there are other factors responsible for the amount of available solar energy besides visible light. The challenge with solar energy in Alaska is that it is dynamic, not reliable, and out of phase with the space heating loads in the state. Yet these challenges can be overcome. Solar energy is on-site, and not subject to transportation system failures. It creates few environmental problems. Solar energy is not inflationary, and it is spread relatively evenly across the planet. The price to harvest solar energy has fallen dramatically over the last decade, and solar PV has no moving parts and minimal ongoing maintenance costs.
Availability of Solar Radiation
The northern latitudes and the Alaska climate are the two most significant factors affecting solar radiation in the state. Both will be discussed below.
Latitude
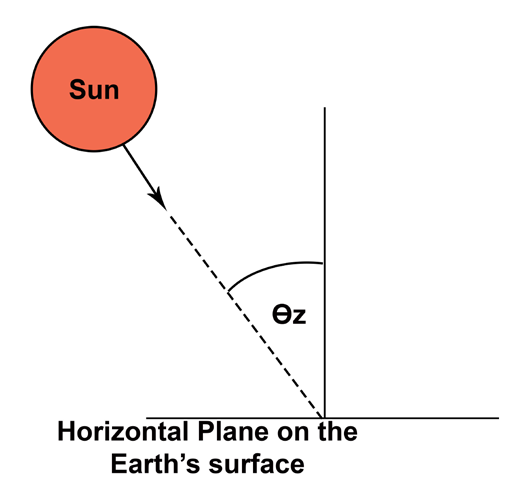
As a very general rule, the farther from the equator a location is, the less solar energy it receives on an annual basis because the intensity of solar radiation is proportional to the angle of the sun above the horizon (solar elevation). As any Alaska resident can attest, the solar resource in Alaska is subject to the annual variability related to latitude. Not only does day length change from approximately 3.5 to 4.5 hours in winter to 20 to 22 hours in summer, depending on the location, but the elevation angle varies in Fairbanks from a meager 2.6° above the horizon on December 21 to 49.5° above the horizon on June 21. The sun is never overhead (at 90°) in Alaska. The maximum height it can reach above the horizon for any place north of the tropics can be calculated by subtracting the latitude from 113.5°. Thus at 64°N the highest solar elevation that the sun reaches is 113.5° – 64° = 49.5°. The actual length of the path that the sun’s rays travel through the atmosphere divided by the minimum possible path of travel if the sun were directly overhead is called the air mass ratio, and it is a useful tool for demonstrating why even on clear days, the maximum available solar radiation is limited in the far north in the middle of winter. The air mass ratio is equal to 1/cos θz, where θz = the zenith angle. The zenith angle is the angle between the zenith and the center of the sun as shown in Figure 3.
The air mass ratio shows that the more atmosphere solar radiation travels through, the more it is reduced. For example, Table 1 shows the theoretical maximum irradiance in Anchorage and Fairbanks during the winter and summer solstices and the spring equinox. This calculation does not take temperature, humidity, albedo, weather, or other similar climactic factors discussed earlier into account, but it helps demonstrate the potential irradiance at various time in the year on a perfectly clear day. In the middle of winter, when the sun is very close to the horizon, there is just not a lot of solar irradiance available in the far north. But starting in February strong solar irradiance begins to return to Alaska.
| December 21 | March 20 | June 21 | |
|---|---|---|---|
| Anchorage | 280 W/m2 | 841 W/m2 | 980 W/m2 |
| Fairbanks | 100 W/m2 | 790 W/m2 | 970 W/m2 |
Table 1. The theoretical maximum irradiance based on the air mass ratios is shown for Anchorage and Fairbanks. This does not take temperature, humidity, albedo, weather, or other similar climactic factors into account.
Climate
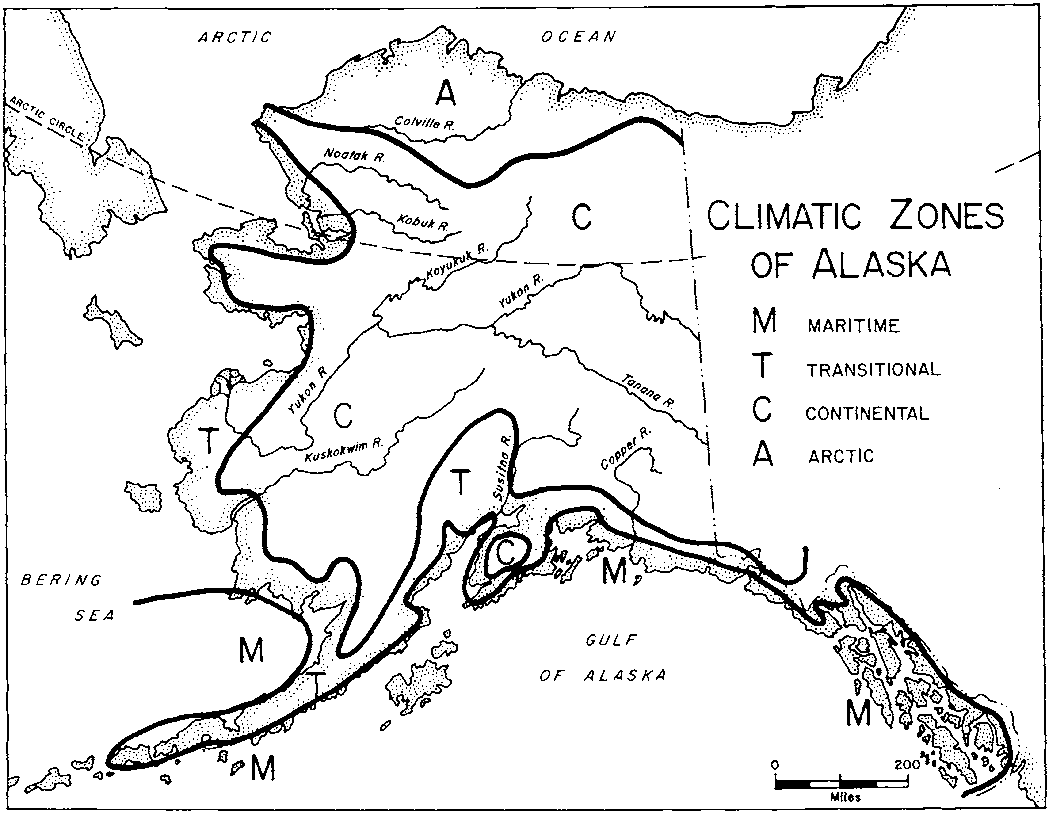
Sometimes solar radiation does not always correlate well with latitude. While latitude is one factor that determines irradiance, the local climatic effects of oceans, mountains, and other geographical elements in Alaska play a more dominant role. Rain shadows caused by large Alaska mountain ranges such as the Chugach and Alaska ranges isolate the Interior and continental climatic regions of Alaska from cloudy weather and precipitation. For these reasons, practical applications of solar energy are most feasible in the continental and transitional areas of Alaska. Both of these areas dominate the Alaska Railbelt (see Figure 4). The definitions of these areas are given below:
Transitional: Pronounced temperature variations throughout the day and year. Low precipitation and humidity. Surface winds generally light. Mean annual temperature generally 25° to 35°F.
Continental: Dominated by continental climatic conditions. Great diurnal and annual temperature variations, low precipitation, low cloudiness, and low humidity. Surface winds generally light. Mean annual temperature 15° to 25°F.
One important factor that directly relates to the state’s climate is what people involved in the solar industry often refer to as “the spring bump.” It is characterized by high power outputs from solar PV panels and is a result of three factors:
- Solar PV panels operate more efficiently during cold springtime temperatures.
- Bright sunny days start returning in mid-February.
- Bright, white snow cover has a high albedo and reflects lots of light off the ground and significantly adds to the solar radiation received by steeply angled solar panels.
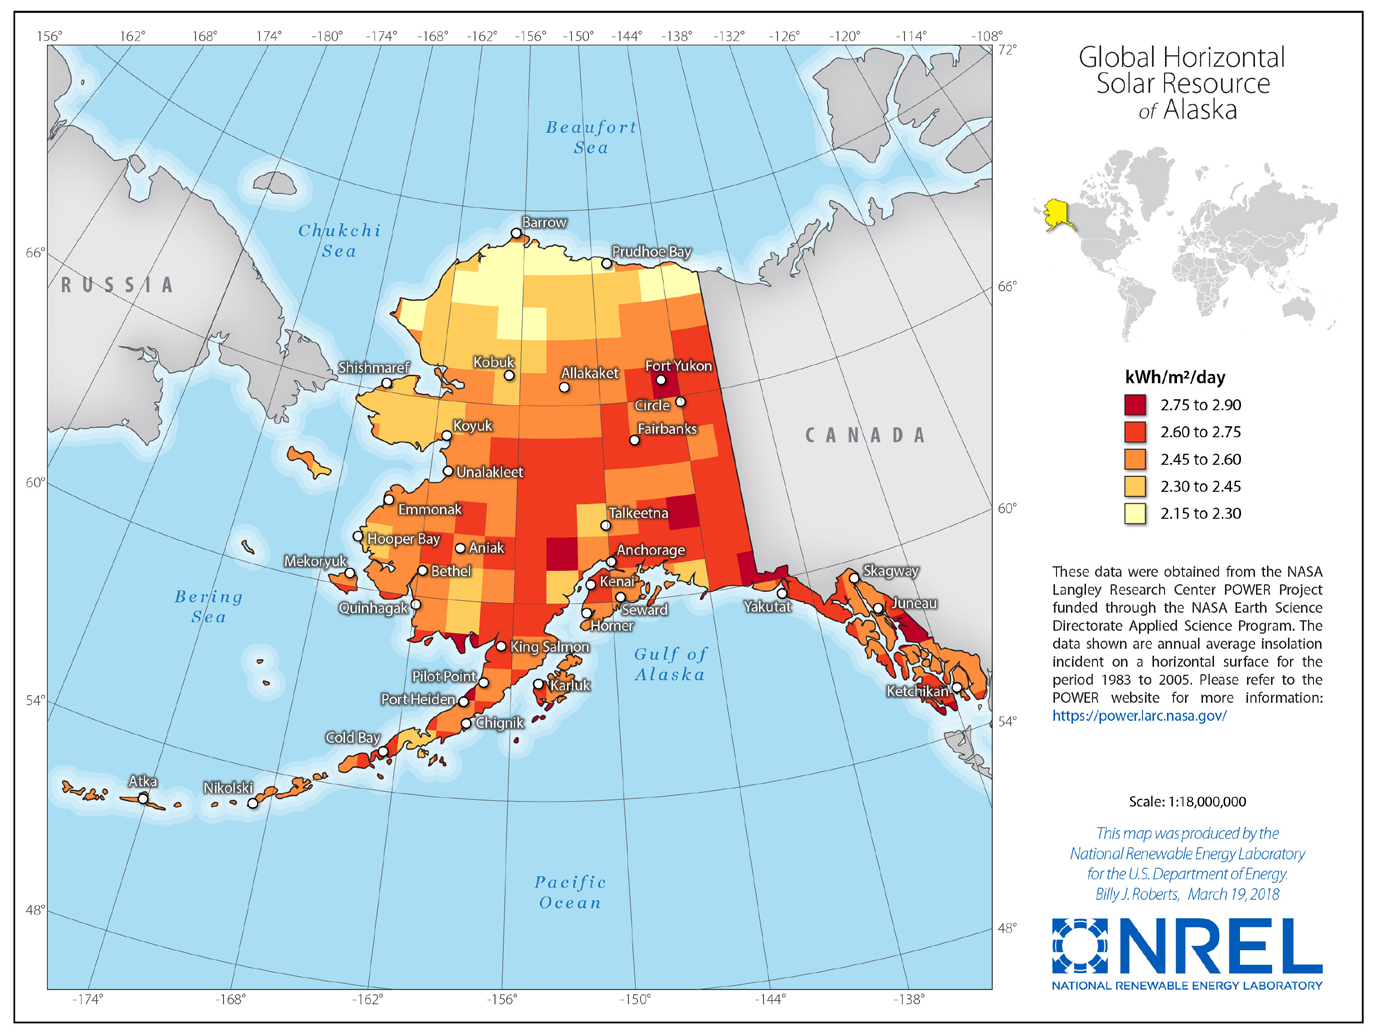
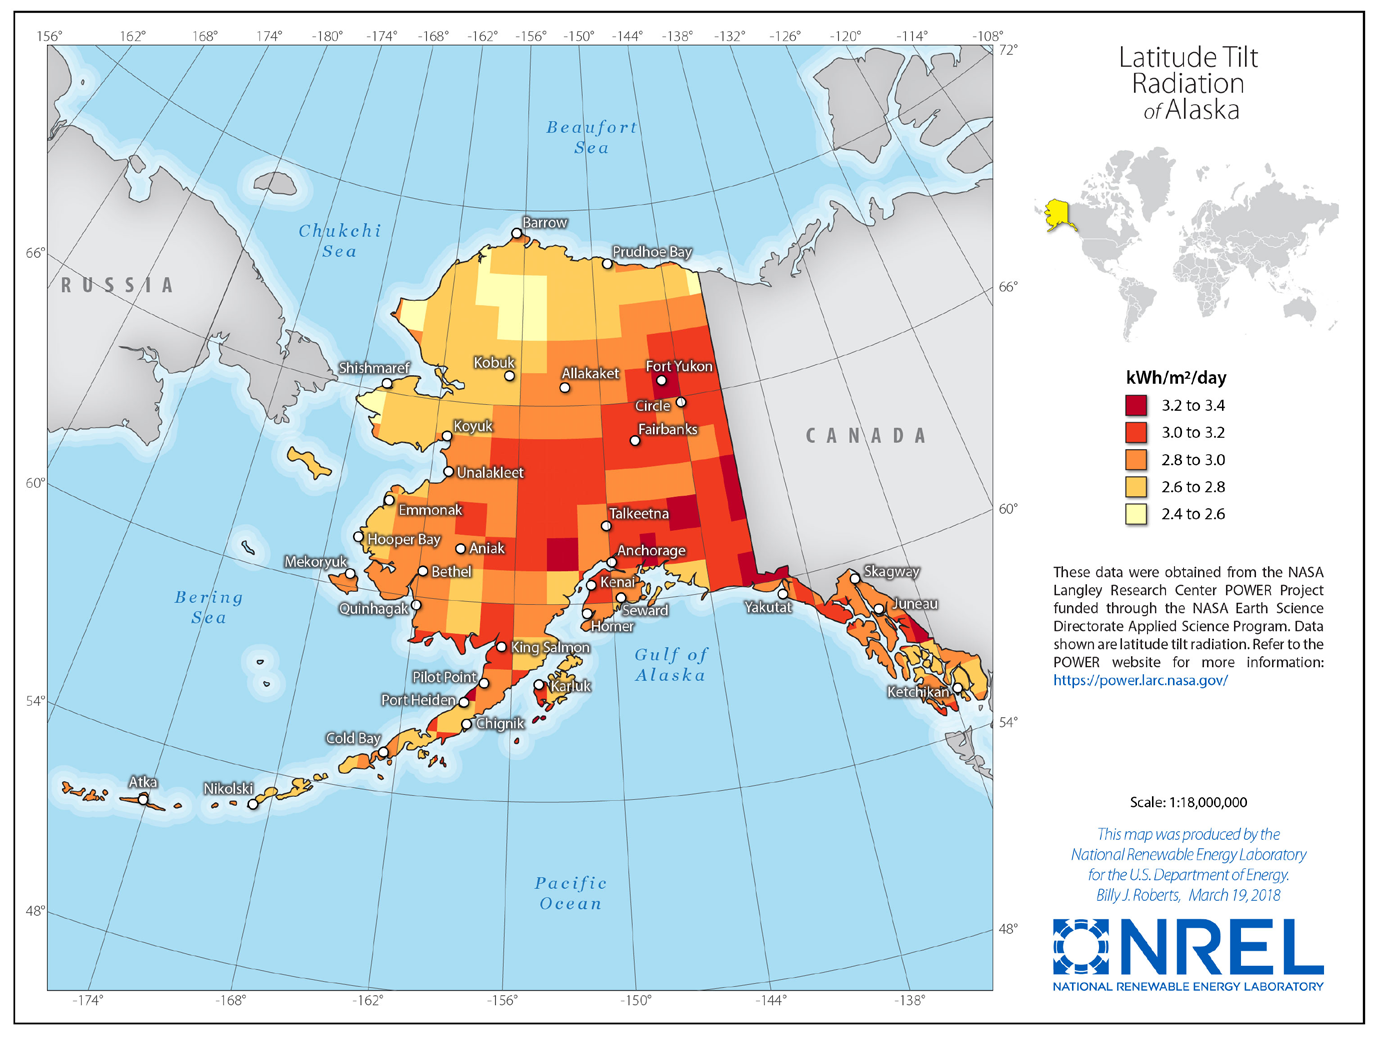
Figures 5 and 6 on pages 10 and 11 show solar irradiance maps produced by the National Renewable Energy Lab (NREL).
Common Applications of Solar Energy
The most common applications for solar energy are the generation of heat and electricity. Both will be covered in varying degrees in this manual
Photovoltaics (solar electricity)
Solar energy can be directly converted to electricity using photovoltaic cells. This application was once used almost solely for power in remote locations. Recently, however, it has become common in grid-tied applications at the residential, community, and utility scales. Photovoltaics in Alaska have made great advances in the past 30 years. The growth in the state solar industry can be seen in Figure 7, which shows Railbelt net metering growth since 2010, most of which is the result of solar PV installations. Systems larger than 25 kW do not qualify for net metering and are not included in this figure.
This manual includes a detailed discussion of photovoltaic solar applications, but it should not be considered an installation manual. Photovoltaics technology is constantly changing and often requires professional assistance to properly install and maintain.
Solar Heating
Solar thermal technology is the heating of a fluid using the sun’s energy. Typically this is done using an auxiliary energy source to move heat from where it is collected to where it is used or stored (usually by a pump or fan). Active solar technologies are practical for providing domestic hot water in Alaska.
Spurred by renewed interest in producing more of the food consumed in Alaska locally, there is a growing interest in greenhouse and agricultural use of solar energy. See Appendix B for solar options available to growers.
References
Hartman, C. W., and Johnson, P. R. (1978). “Environmental Atlas of Alaska.” University of Alaska Fairbanks, Institute of Water Resources.
Horta, P., Carvalho, M. J., and Fischer, S. (2008, October). Solar thermal collector yield: experimental validation of calculations based on steady-state and quasi-dynamic test methodologies. In “Eurosun 2008: 1st International Conference on Solar Heating, Cooling and Buildings.”
Photovoltaic Systems
How Solar PV Works
Solar photovoltaic cells convert solar energy to electrical energy. Together a group of PV cells make a module. Solar cells are small, square-shaped semiconductors made from silicon and other conductive materials. When packets of solar energy called photons interact with solar cells, electrons are displaced and form the DC electricity that flows out of the PV modules towards the load. Depending on the type of PV installation, the electricity flows through a series of storage and power electronics devices before it is delivered as 110 V AC electricity to the appliances in your home.
In the early days of residential PV, all systems were installed in homes that were not connected to the utility electrical grid. These systems required storage to provide energy when the sun was not shining. Power electronics were primitive by today’s standards and inverters were not as efficient or reliable as they are today. Because of this, many of these early off-grid solar homes used DC electrical appliances so that they could use power straight from the panels and batteries. DC appliances tend to be more expensive and harder to find than their AC counterparts, and recently most homes that use solar power, whether on-grid or off-grid, use inverters to convert the electricity to AC. In those early days, the cost of solar could never compete with the price of electricity supplied by the grid. People who self-generated did so either out of necessity or for ideological reasons. This is no longer the case in many locations. Advances in technology and reductions in component pricing have made solar price-competitive with most forms of electrical generation. System economics will be discussed later in this guide.
The purpose of this chapter is to give the reader an understanding of how a basic solar PV system works so that readers can understand how the components work together and what design considerations they need to be aware of. It is not the purpose of this chapter to teach you how to become an electrician or a PV design pro. Electrical wiring is serious business. Most solar electric systems produce lethal voltages, and even those that don’t can burn a house down if wired improperly. If you are unsure of what you’re doing please err on the side of safety and consult a licensed electrician or other qualified professional before purchasing materials or starting to work on any electrical project.
10 Key things to remember if you are thinking about installing a solar PV system
- Energy efficiency is the most important part of a well-planned system. Assess your building for energy saving potential as part of your solar planning.
- Communicate with your utility early in the planning process and make sure you understand their rules and regulations regarding distributed generation.
- Choose a credible PV manufacturer; do NOT be willing to be the first field test.
- Choose a credible installer who has experience installing systems in your area.
- Read the utility interconnect agreement carefully. Many utilities have minimum liability insurance requirements.
- Familiarize yourself with the available tax credits and consult with a tax professional if necessary
- Take time to investigate the different financing options which may be available to you.
- Does your roof have less than ten years of life left? If so, it might be wise to reroof before installing a rooftop PV system.
- Make sure your electrical service is up to code. If it’s not, you will likely have to bring it up to code before installing solar PV.
- What are the goals for your solar PV system? Will the modeled solar energy production align with these goals?
Assessing the Solar Resource and Planning the System Layout
Geometry of Solar Collection in Alaska
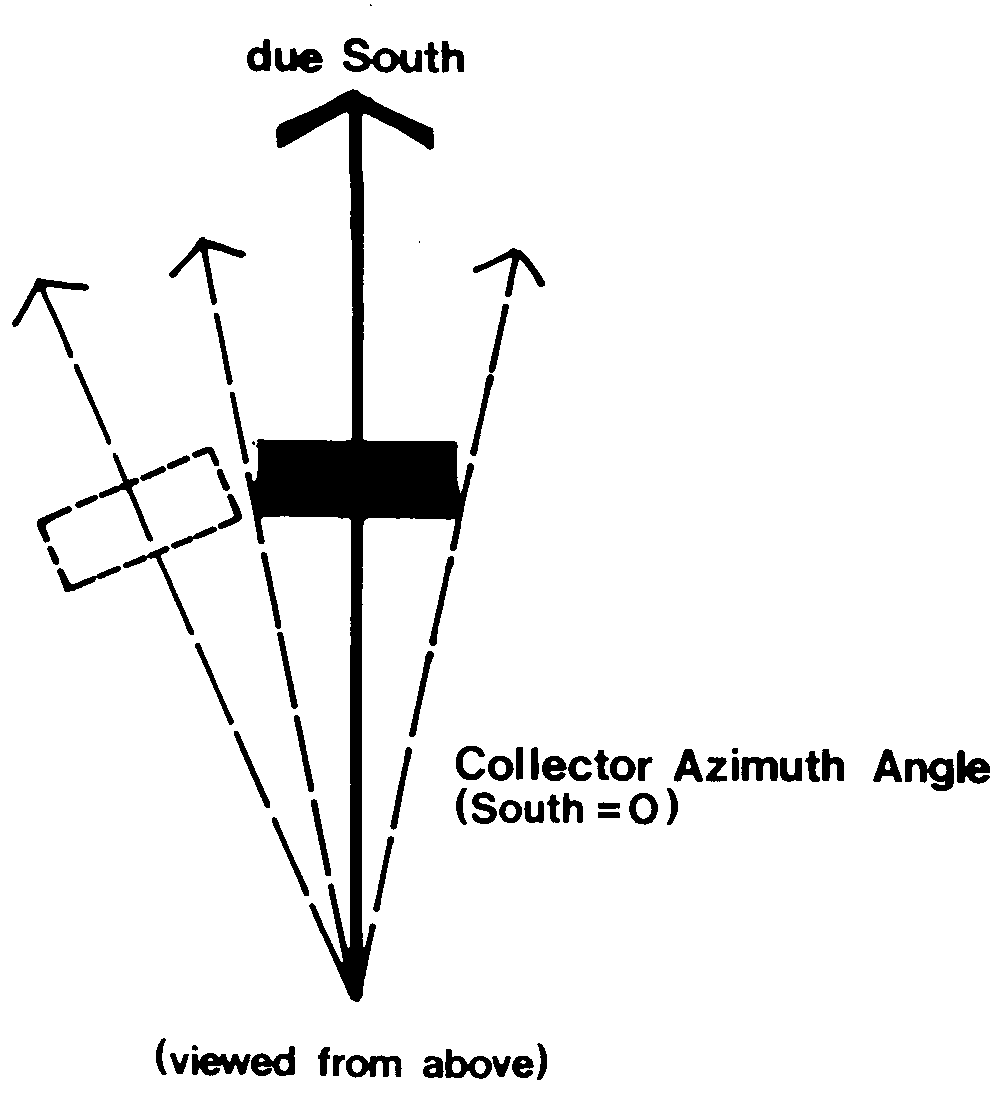
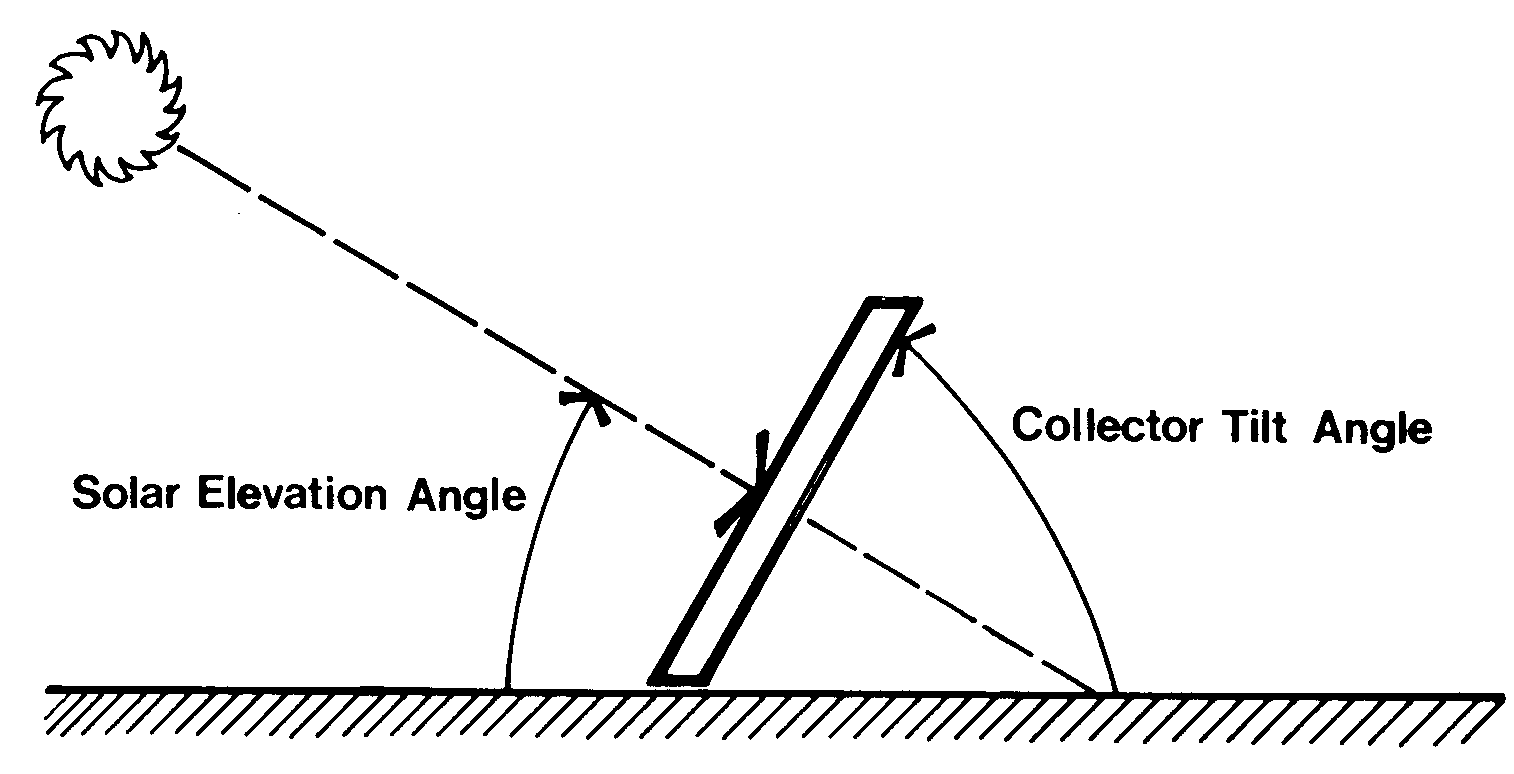
A solar collector’s performance is somewhat sensitive to the tilt of the collector from the horizontal as well as its azimuthal (east or west of south) orientation. Figures 1 and 2 indicate the important angles to consider in active solar designs. Collector tilt in Alaska depends upon the desired application. To optimize the collectors for winter time, a tilt greater than the latitude would provide optimum radiation capture. Keep in mind, however, that solar radiation is limited during the Alaska winter, so such a strategy would reduce the amount of solar energy captured on a yearly basis. A collector tilt less than the latitude optimizes for the best production on an annual basis.

The roof is often the first place that people think of to install solar panels, and for good reason. It is a ready platform, often tilted towards the south. When considering the optimum azimuth and angle at which to install solar panels, it often comes down to a trade-off between cost and production. In most locations in Alaska, the ideal orientation to maximize annual energy output of solar electric panels is pointed due south and tilted at or slightly less than latitude. An excellent tool to demonstrate the energy output from various solar panel orientations at various locations around the state is located at this website built by Conroy Whitney using PVWatts modeling performed by Alan Mitchell: http://solar-contour-plot.conroywhitney.com/ (see illustration above).
It is often advantageous to install a system at an angle less than latitude. This is because Alaska gets such a high percentage of its sun in the summer. In addition, the website demonstrates that if a roof isn’t optimally sited, the losses from installing panels slightly east or west of south and at a pitch much less than latitude might only be a small percentage. For example, if a Fairbanks roof is facing southwest at a 25° slope, installing a PV system parallel to the roofline will result in production losses of only about 15% from optimum orientation. This may very well be a worthwhile sacrifice to avoid paying the higher racking costs to install the system at a steeper angle or different azimuth. In addition, steeper racking on roofs often leads to wind loading issues and could add additional engineering requirements to the system installation. If a steeper angle is desired to maximize winter and spring production, investigate mounting the array on a south-facing wall. These facts show that there is much more opportunity for architectural and siting variation than is normally assumed. Flat arrays, however, are not recommended in Alaska since they won’t shed snow well enough to take advantage of the spring solar resource.
Shading and Topography
Trees and shading from other buildings should be carefully reviewed on site before a final collector design is chosen. Remember that small trees become big and it could become necessary to remove them in the future to maintain good solar access. In some areas, people have negotiated solar easements from neighboring properties to ensure “solar access,” the guarantee that nothing will be constructed or allowed to grow that will shade their solar collectors.
Sun Path Diagrams
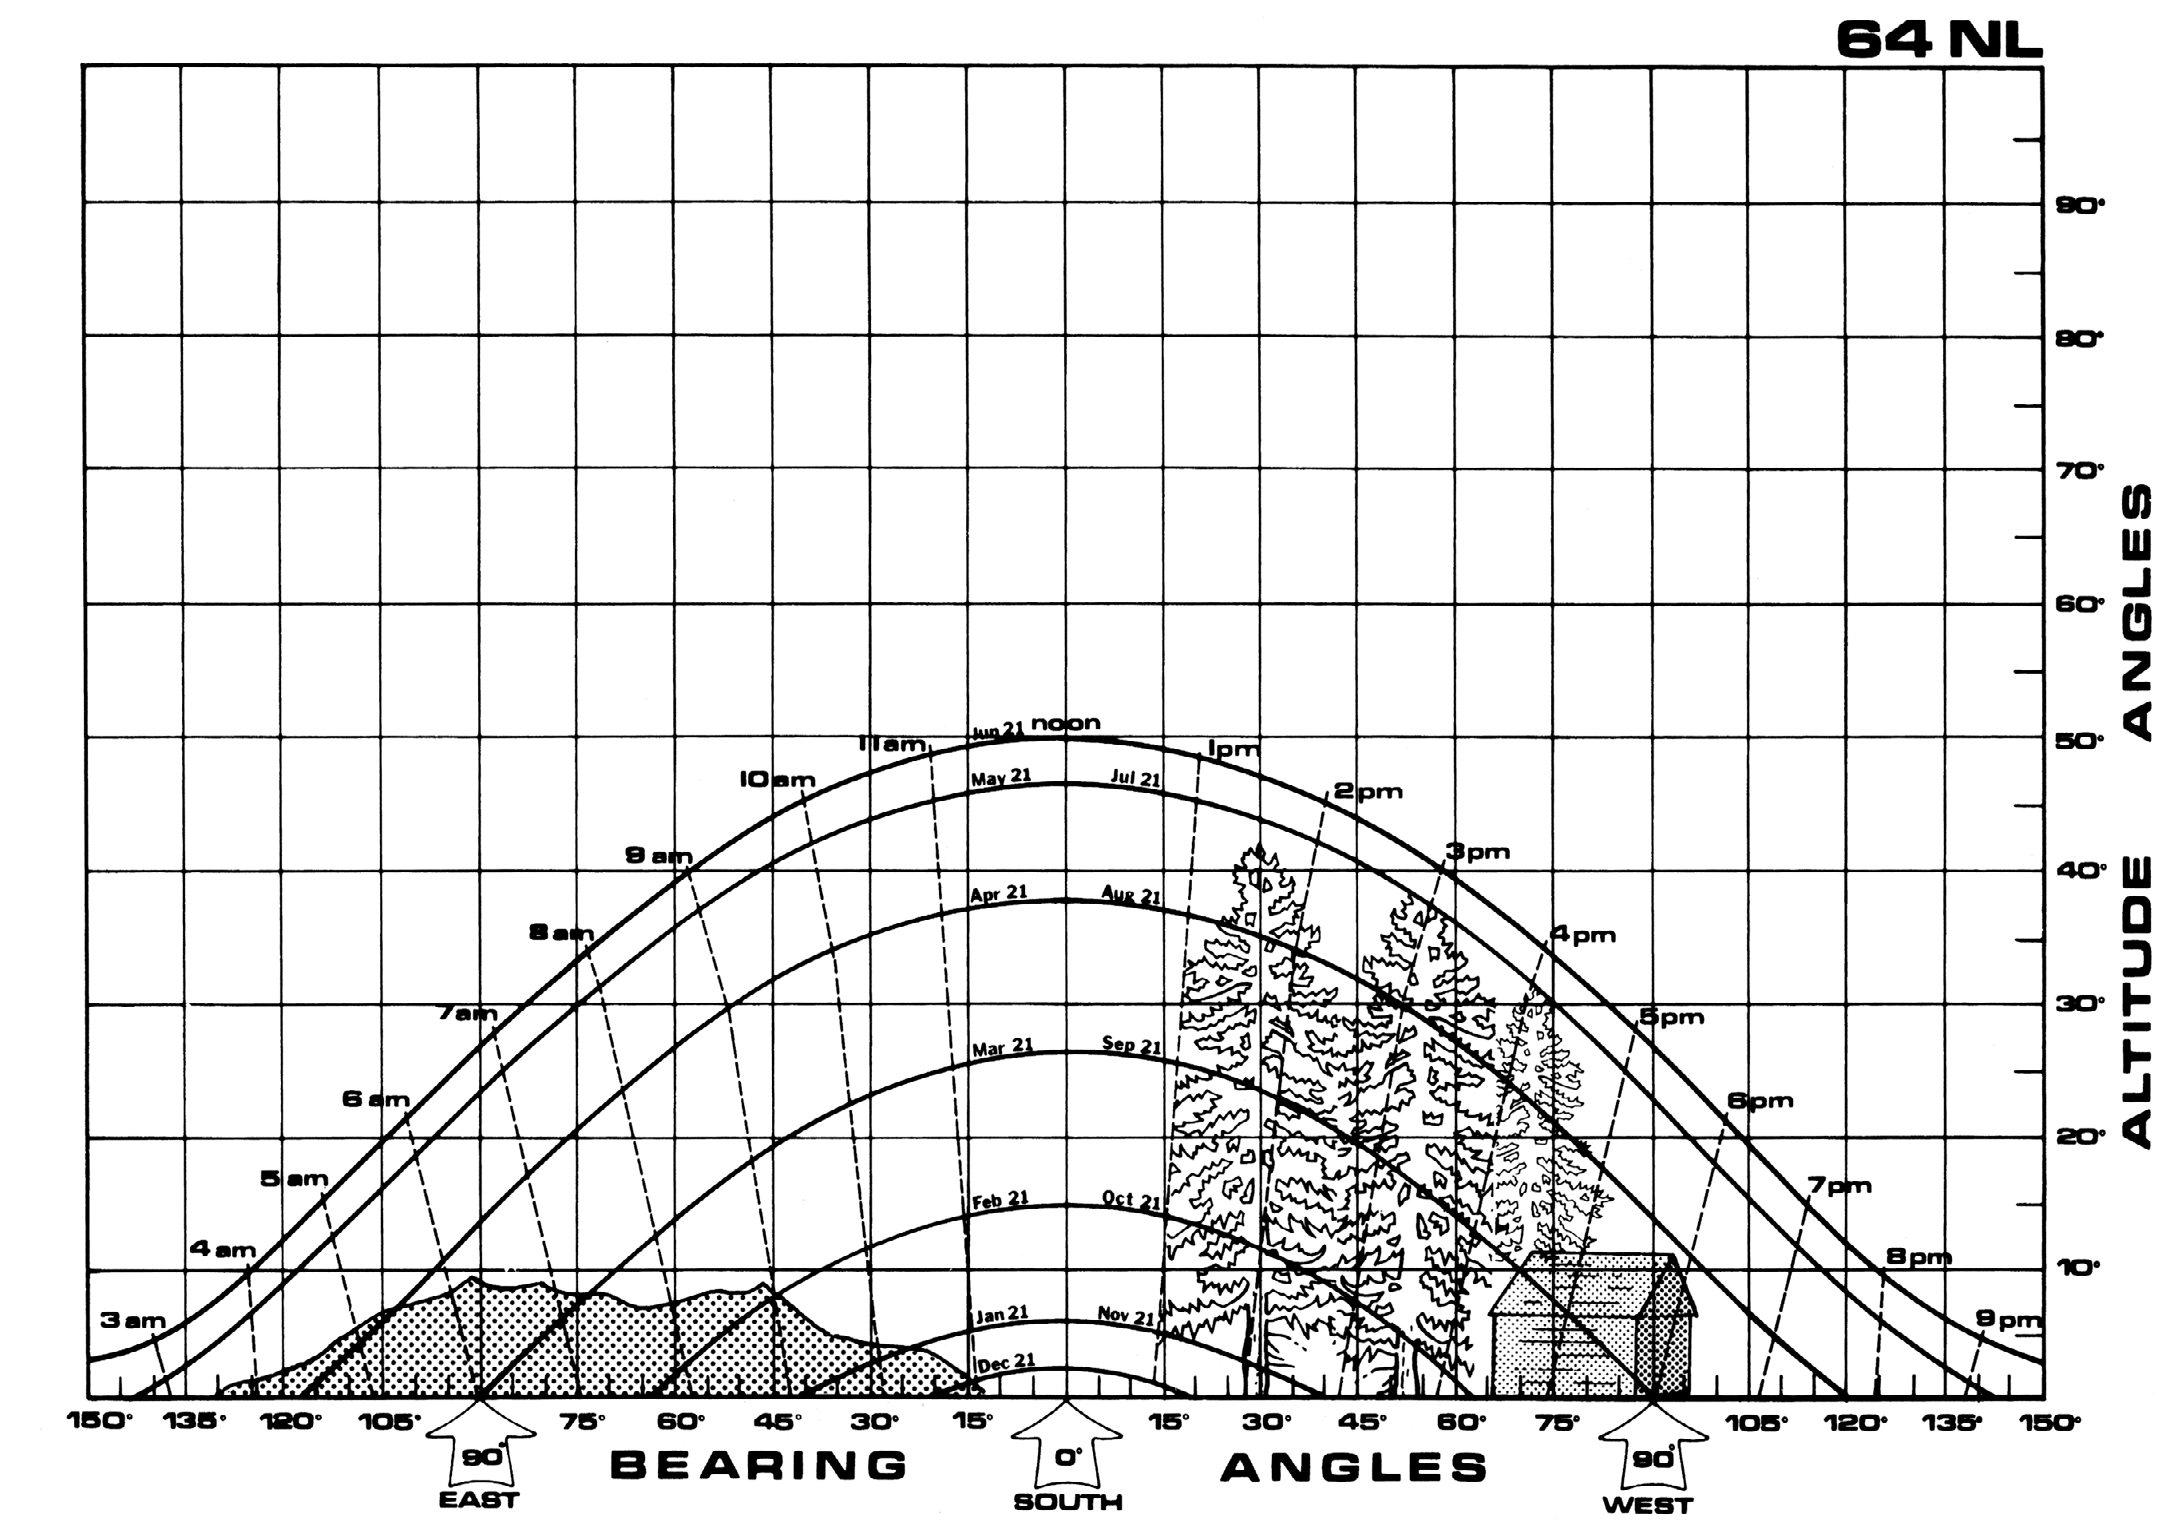
It is possible to predict the position of the sun at any time. The path and the position depend on the latitude of the site. A sun path diagram is a graphic representation of the path of the sun in the sky for virtually any time of the year. This type of sun path diagram is useful for architectural insights, since a horizon can be sketched onto it to indicate solar obstructions. Sun charts for any location can be downloaded from the University of Oregon Solar Radiation Monitoring Lab website at http://solardat.uoregon.edu/SunChartProgram.html.
Sketching the horizon onto the chart enables the prospective solar user to identify the major obstructions that will shade the collector from the sun in their true angular perspective. In the early days of solar PV technology, a hand level was used to get the angular elevations of obstacles. With the advent of smart phones, however, there are a number of apps, such as the Sun Surveyor app, that identify the angle and azimuth of solar obstructions, which can easily be traced onto a sun path chart.
In Figure 3, the trees are the major obstruction. Identifying such obstructions by location can also indicate how much sun is actually blocked by the obstruction. Let us examine the situation in March. Using the March 21 sun path for Fairbanks, Alaska, we can see what happens during the day. Beyond 74° east of south, the sun is blocked by the hills to the southeast of the site, so sunrise is delayed until the sun clears the hills. This delay is 1 hour 20 minutes on March 21. From 7:20 a.m. until 1:20 p.m., the sun is unobstructed. The trees to the southwest of the site obstruct the sun during the entire afternoon; the site gets virtually no direct afternoon sun after 1:20 p.m.
This can be quantified by downloading the hourly data for your location from PVWatts.
The hourly production for periods where shading will occur can be corrected in an Excel document from the original PVWatts estimate. For example, if the sun chart shows that shading will occur every day in March before noon, all of the PVWatts estimates can be corrected as appropriate to show little or no output before noon on March.
This suggests the need to do whatever one can to remove significant obstructions. Increasing the size of the collection area is also an option that could be worth exploring.
Snow Cover Effects
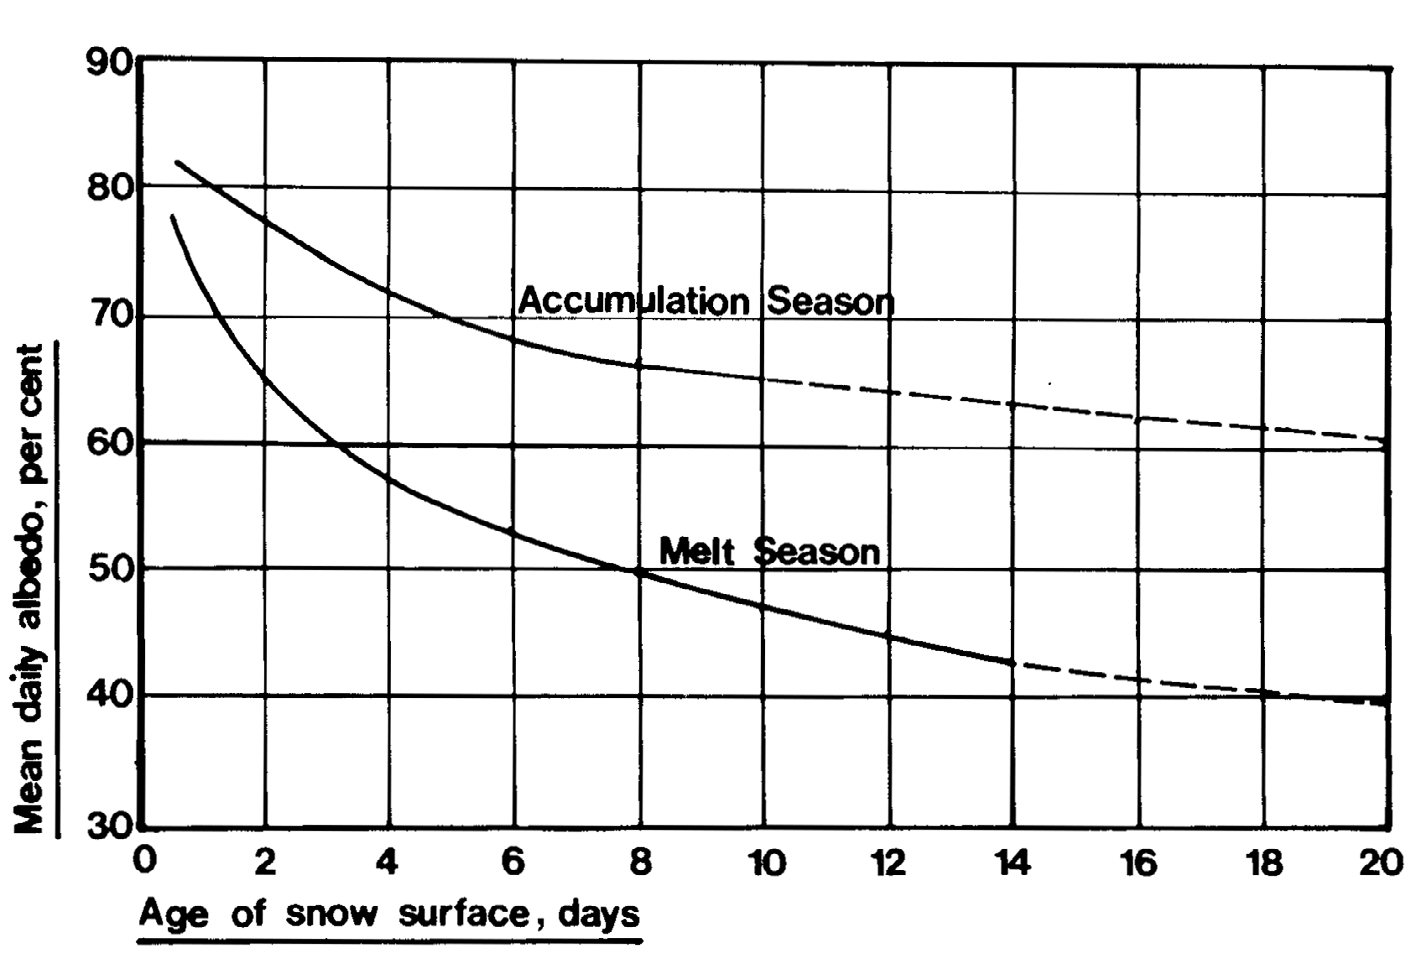
A positive factor for solar energy capture in Alaska is the seasonal snow cover. As can be seen in Figure 4, new snow has a reflectivity (albedo) of 70% to 80%. This is four times the reflectivity of normal ground cover. In effect, snow acts as a very efficient mirror, reflecting additional radiation onto the collector. Research suggests that snow cover can enhance the collection of solar energy from 15% to 30%. This has been solidly confirmed in Alaska, even for years that are much cloudier than normal (Seifert, 1983).
Solar PV Modeling Best Practices
Modeling PV output is an important part of the planning process. Over the last several decades, solar PV models have improved and these models are now able to accurately calculate the output of a PV array in various weather conditions. The most common and easiest-to-use model for estimating the electrical output of a solar PV system is PVWatts. It was created by the National Renewable Energy Lab and is available free of charge on its website and includes standard representative weather files for certain regions. A general understanding of the model inputs and outputs is helpful to better understand the conditions that effect the output of a solar PV system. The equation that PVWatts uses when the plane of array irradiance is greater than 125 W/m2 is shown below(Dobos, 2014):
Pmp = Ee / E0 Pmp0 [1 + γ (Tc - T0)]
Where:
Ee is the effective irradiance
- E0 is the reference irradiance (1000 W/m2 )
- Tc is the PV cell temperature
- T0 is the reference temperature (25°C)
- Pmp is the maximum power point
- Pmp0 is the reference rated output of the panel
- γ is the temperature correction for maximum power (Values range from -0.47 %/°C to -0.35 %/°C for crystalline modules) PVWatts uses a slightly different equation at low irradiance levels, but for the sake of simplicity we will focus on the equation above.
Each of the variables above includes a variety of other inputs. For example, the PV cell temperature is not the same as the ambient temperature. Total incident POA (plane of array) irradiance, wind speed, and dry bulb temperature are used to calculate the operating cell temperature. Similarly, “effective” irradiance is the amount of irradiance that is available for conversion to electrical current. It includes losses from reflections (function of angle of incidence), soiling or snow on the module surface, and spectral mismatch.
If you are interested in learning more, you can review the PVWatts Version 5 manual at http:// pvwatts.nrel.gov/downloads/pvwattsv5.pdf.
The Sandia National Lab PV performance modeling collaborative (PVPMC) website also has detailed descriptions of the equations that underlie the PVWatts model and information about how to calculate cell temperature and effective irradiance: https://pvpmc.sandia.gov/
The PVWatts model is a very general (yet proven) modeling toolset that is adequate for most residential situations. If more detailed modeling is necessary — e.g., inclusion of shading effects, distinguishing between different module and inverter models, oversizing of the DC array relative to the inverter capacity, etc. — there are additional free modeling tools that include the SAM (System Advisor Model) from NREL and the PVLIB Toolbox available at the PVPMC website above.
When using any modeling tool, it is important to consider multiple input data sources (e.g., weather files). For example, PVWatts has six different weather data sets to choose from in the Anchorage area. While solar resource can vary significantly over short distances because of microclimates, there is also a significant variability in the quality of the weather data sets that are available, and it is always advisable to run predictions using several nearby sites to estimate uncertainties. For example, in Anchorage, the Birchwood weather data set shows a significantly higher solar resource than the other data sets in the area and may be overestimating system output. Users should take the time to use multiple data sets to quantify possible uncertainty. If they disagree by a large margin, more investigation will likely be necessary and a more conservative estimation about a system output might be warranted.
Publicly Available Solar Resource Datasets
There are generally two solar radiation datasets referenced in this report, the National Solar Radiation Database and the NASA Surface Meteorology and Solar Energy Dataset. There are many other models that derive irradiance at the Earth’s surface from satellite data, but these are the most widely available for Alaska.
NASA Surface Meteorology and Solar Energy Data Set
NASA’s Prediction of Worldwide Energy Resource (POWER) has a goal to observe, understand, and model the Earth system to discover how it is changing, to better predict change, and to understand the consequences for life on Earth. Included in this project is the Surface meteorology and Solar Energy (SSE) project. The SSE project was initiated to provide internet-based access to parameters specifically tailored to assist in the design of solar- and wind-powered renewable energy systems.
Data access and a description of the SSE dataset can be found here.
This dataset is used by the modeling programs Homer and RetScreen. The SSE dataset was also used by NREL to develop the irradiance maps shown in the introduction of this manual and is considered the most accurate publicly available dataset for locations north of 60 degrees latitude.
The solar radiation data is derived from satellite observations and meteorological data from the Goddard Earth Observing System assimilation model. A detailed description of the modeling used to develop this data set can be found here at NASA Power. National Solar Radiation Database (NSRDB)
The National Solar Radiation Database is a collection of meteorological and solar irradiance datasets for locations around the world. It was first released in 1979 and the most recent release occurred in 2015. Initially the dataset contained was derived from land-based measurements, but ground-based solar measurements are hard to take and extremely expensive. With each subsequent release, the dataset has grown and contains a higher percentage of modeled sites. Starting with the 2007 release, the dataset consisted only of modeled locations. The 2015 release includes half-hour satellite-modeled solar data for 1998-2014 on a 4 km grid. It covers 23°W to 175°W and 20°S to 60°N. North of 60°N the satellite-modeled solar data becomes unreliable. Unfortunately, Anchorage lies at about 60°N so most of Alaska is not included in this latest release. PVWatts cannot use the newest NSRDB in Alaska, but one can still use the older typical meteorological year (TMY) data which is available for various points around Alaska. TMY2 data, which contains more measured sites, tends to be more accurate if it is available near the desired location. The NSRDB can be accessed at NSRDB: National Solar Radiation Database.
Basic Solar PV System Components
Sanchez and Woofenden (2011)
This section briefly discusses the different components of a basic off-grid and grid-tied PV system and how they work together. Solar PV technology has gone through many changes since this guide was last updated 10 years ago. In general, the newer components fit together more easily and are designed so that the system is simpler, with reduced labor and installation times. In addition, codes at the local, state, and national level continue to change and become more robust and detailed. The components described throughout this guide are continually evolving to comply with these tougher and more complicated guidelines.
Understanding the basic components of a solar PV system and how they function is not an overwhelming task but it does require some study. Following are some brief descriptions of the common equipment used in grid-intertied and off-grid solar-electric systems. Systems vary and not all the equipment described here is necessary for every system type.
Solar-Electric Panels, aka Photovoltaic (PV) Panels
PV panels are a solar-electric system’s defining component, where sunlight is used to make direct current (DC) electricity. Behind a PV panel’s shimmering facade, wafers of semiconductor material work their magic, using light (photons) to generate electricity through what’s known as the photovoltaic effect. Other components in your system use the electricity generated by your solar-electric panels to safely power your electric loads, such as lights, computers, and refrigerators.
Electrical Terminology
Before we go any further we need to define some terms. For our purposes a few simple definitions are all we need.
Voltage is the difference in potential energy. Think of the difference between the positive (+) and the negative (-) terminals on a car battery. For example: if you connected a volt meter across the posts on a car battery the meter would normally indicate about 12 volts.
Amperage or electrical current refers to the electrical charge carried by moving electrons. In our case these electrons are flowing over a wire.
Power is defined as the rate at which electrical energy is transferred, and the unit that power is normally expressed in is the watt (W).
The way these three items relate to each other can be shown by the equation
Power (watts) = V (volts) x A (amps)
Watt-hour pertains to the usage of power over time. For example if you leave our 1 watt light bulb on for a period of 1 hour you will have used 1 watt-hour of energy. Watts X amps = watt-hours (Wh). If you pay an electric bill you may be familiar with the term kilowatt-hour (kWh). A kWh is equal to a thousand W-h.
Amp-hour also pertains to the usage of power over time. It’s included here because storage batteries are rated in amp-hours. If you power a 1 amp load for a period of 1 hour you have one less amp hour in your battery.
PV panels are assigned a rating in watts based on the maximum power they can produce under a standard sun and temperature condition. You can use the rated output to help determine how many panels you’ll need to meet your electrical needs. Multiple modules combined together are called an array.
Recently, some panels have been marketed as AC panels. These panels have a microinverter integrated into them that converts the DC electricity into AC current.
Most panels in use today are made from silicon and can be divided into two types: monocrystalline silicon and polycrystalline silicon panels, which are made of the same materials with different manufacturing processes. Monocrystalline panels are more efficient and more expensive. In addition, it is generally accepted that they perform better in low light conditions. Examples of both are shown in Figure 5.
In addition to silicon PV cells, the thin-film process is gaining market share as the technology continues to improve and the price drops. The different types of thin-film solar cells can be categorized by which photovoltaic material is deposited onto the substrate. Photovoltaic materials include amorphous silicon, cadmium telluride, copper indium gallium selenide, and organic photovoltaic cells. Depending on the technology, thin-film modules have efficiencies around 10%; however, there is continued hope for higher efficiencies in the future.

A rigid panel made of silicon is the most common form of solar collector, but PV technology has also been integrated into roofing shingles and tiles and even peel-and-stick laminates. These technologies are still in the emerging stages.
PV modules are designed to withstand severe weather, including extreme heat, cold, and hail-stones. All reputable PV panels should have at least a 25-year warranty. While some degradation in power output over time is normal, consumers should look for some kind of performance guarantee over time. Most reputable manufactures will guarantee that after 25 years actual power output will be no less than 80% of the original labeled output. For example, the warranties from Canadian Solar are shown in Table 1.
Table 1. The Canadian Solar module warranty (shown below) covers a period of 25 years. All reputable solar PV modules should have a similar warranty for at least 25 years.
Polycrystalline Module Products
During the first year, Canadian Solar warrants the actual power output of the module will be no less than 97.5% of the labeled power output.
From year 2 to year 25, the actual annual power decline will be no more than 0.7%; by the end of year 25, the actual power output will be no less than 80.7% of the labeled power output.
Monocrystalline Module Products
During the first year, Canadian Solar warrants the actual power output of the module will be no less than 97% of the labeled power output
From year 2 to year 25, the actual annual power decline will be no more than 0.7%; by the end of year 25, the actual power output will be no less than 80.2% of the labeled power output.
*Source: Canadian Solar
Solar modules have certain electrical characteristics that must be considered when designing a grid-connected system. For instance, solar modules produce the highest voltages when they are exposed to sunlight but are not generating electricity. This counterintuitive phenomenon is called open-circuit voltage, or Voc. Solar modules also produce higher voltage when they are cold. The image in Figure 6 shows a specification label for a 285 W monocrystalline module manufactured by Canadian Solar.
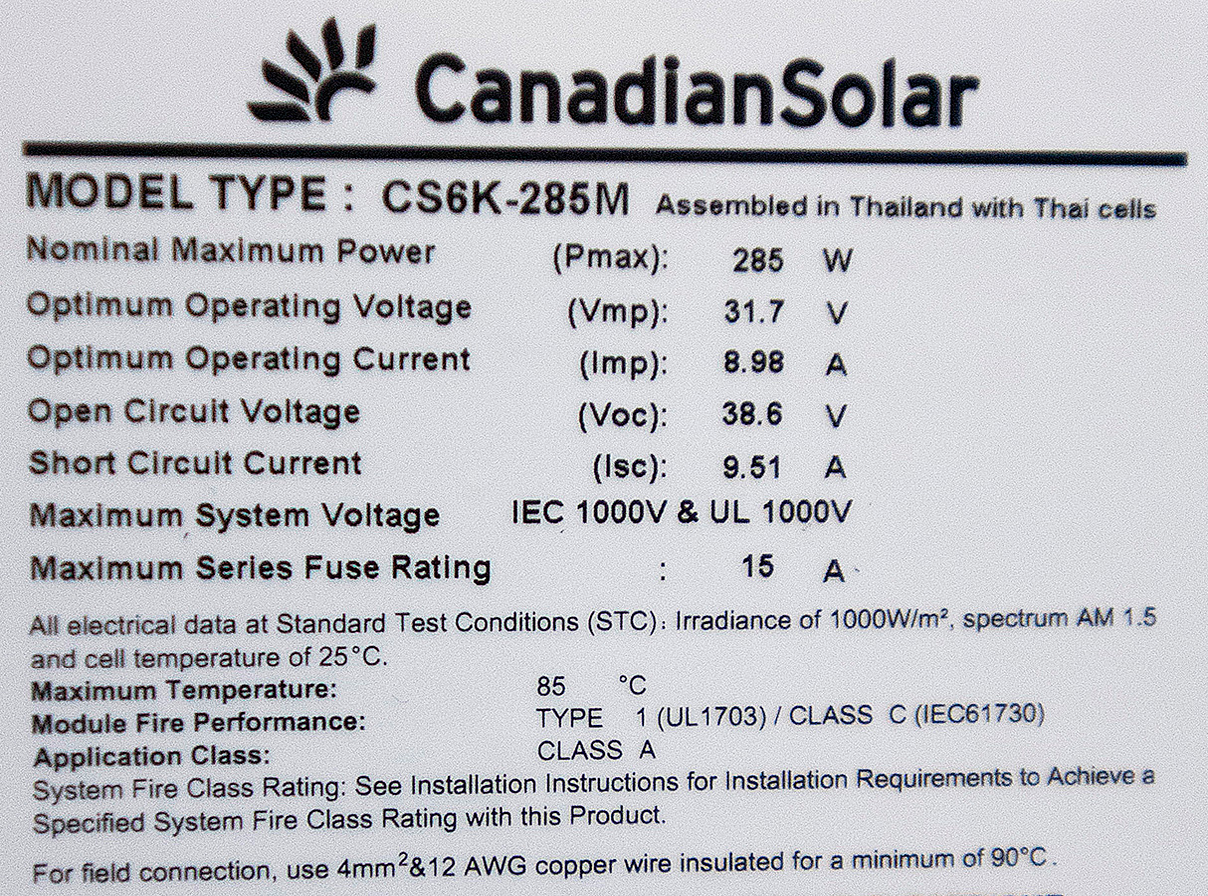
Looking at Figure 2 you can see that the open-circuit voltage (Voc) is 38.6 VDC but the rated voltage (Vmp) is listed at 31.7 VDC. For example, say we have a 3,000 W inverter and we want to string 10 of these 285 W solar modules together. The minimum operating voltage for the inverter we’ve chosen is 250 VDC. It looks like 10 modules in series will give us about 317 VDC, so it looks like we’re in good shape there. If the maximum voltage listed on the inverter is 500 VDC, then ten modules in series should give us about 386 VDC during open-circuit conditions according to the label.
Notice that the solar cell temperature at Standard Test Conditions is 25°C. In places like Fairbanks it can get a lot colder than 25°C and still be very sunny out so if we assume a low temperature of -40ºC we have to multiply the Voc by 1.25 according to the National Electric Code. When we multiply 386 VDC by the correction factor of 1.25 we now have 483 VDC. This would keep us safely below the 500 VDC limit.
Referencing Figure 6 again, we can see that the module has a short-circuit current (Isc) of 9.51 amps and an optimal operating current (Imp) of 8.98 amps. If we multiply the Vmp of 31.7 volts by the Imp of 8.98 amps we get 285, which is the rating of the module at standard test conditions (STC).
Array Mounting and Racking
Mounting racks provide a secure platform on which to anchor PV panels in place and orient them correctly. Panels can be mounted in one of three locations:
- On a rooftop (roof-mounted) (Figure 7)
- Atop a steel pole set in concrete (pole mounted) (Figure 8)
- At ground level (ground mounted) (Figure 9)
The specific pieces, parts, and materials of the mounting device will vary considerably depending on which mounting method is choose.
Usually, arrays in urban or suburban areas are mounted on a home’s south-facing roof, parallel to the roof’s slope. This approach is sometimes considered most aesthetically pleasing and is usually the least expensive. Manufactures have designed a wide range of flashing and attachments designed to provide leak-free mounting attachments for every conceivable type of roof. In areas with space or orientation constraints, pole- or ground-mounted arrays are another choice.
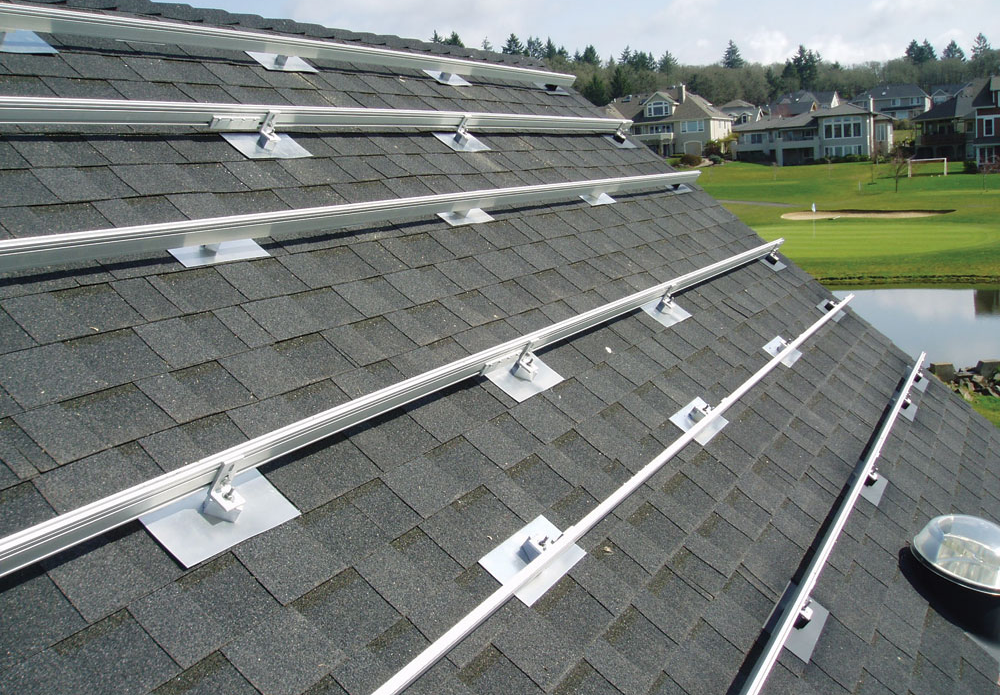
Solar module racking has come a long way over the last decade. Modern racking designs are more robust and easier to install than they were in the early days of solar PV. Racking comes pre-engineered for a variety of snow and wind-loading conditions and can be designed to customer-specific situations through the use of online company portals. One major advancement that PV racking has made is the integration of equipment grounding systems into the racking design, which save installers time and materials compared to the early days of having to run copper grounding wire between each module frame and rail. Some of the major brands that consumers may encounter during their research include Iron-Ridge, SnapNrack, and Unirack. These are just a few of the many types and brands of racking available.
There are a couple of issues to be aware of when it comes to racking. Some people who have installed solar PV in Interior Alaska, where swings in temperatures between the winter lows and summer highs can reach 150°, have reported that they prefer steel racking as opposed to the more common aluminum racking because of concerns with expansion and contraction. Aluminum expands and contracts up to 30% more than steel. At the very least, if solar is being installed in this climate, installers should check with the racking manufacture and use Nylock hardware when possible.
Trackers
Pole-mounted PV arrays can also incorporate tracking devices that allow the array to automatically follow the sun across the sky from east to west each day. Tracked PV arrays can increase the system’s daily energy output by 25% to 40% (Colgan et al., 2010).
In the early days of PV, modules were by far the most expensive part of a system. For this reason, it was necessary to maximize the energy production of each module throughout every part of the year to maximize system production and minimize cost. More recently, however, the price of modules has fallen dramatically. One of the greatest advantages of solar PV is the lack of moving parts. When a tracker is used in a system it adds complexity and an additional way for the system to fail. For this reason, most installers steer customers away from using trackers and instead encourage the installation of additional modules.
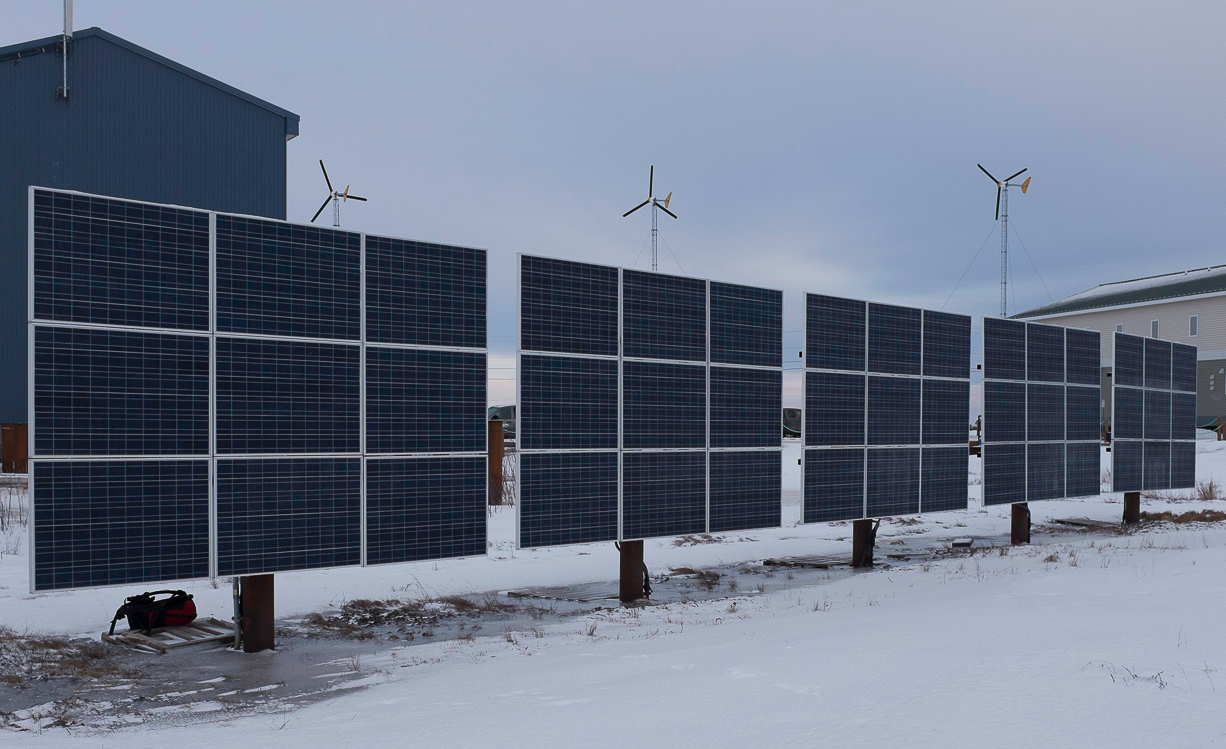
Some customers have successfully used manually adjustable pole-mounted arrays to minimize system complexity while maximizing production by manually changing the array tilt angle a couple times each year. An example is shown in Figure 10.
Adjustable mounting racks enable someone to set the angle of the PV panels seasonally, keeping them aimed more directly at the sun. In addition, the steep winter angles facilitate snow shedding. While systems like this will likely cost slightly more to install, they could be advantageous in certain situations. Customers should consider their own situation and constraints.
Inverter
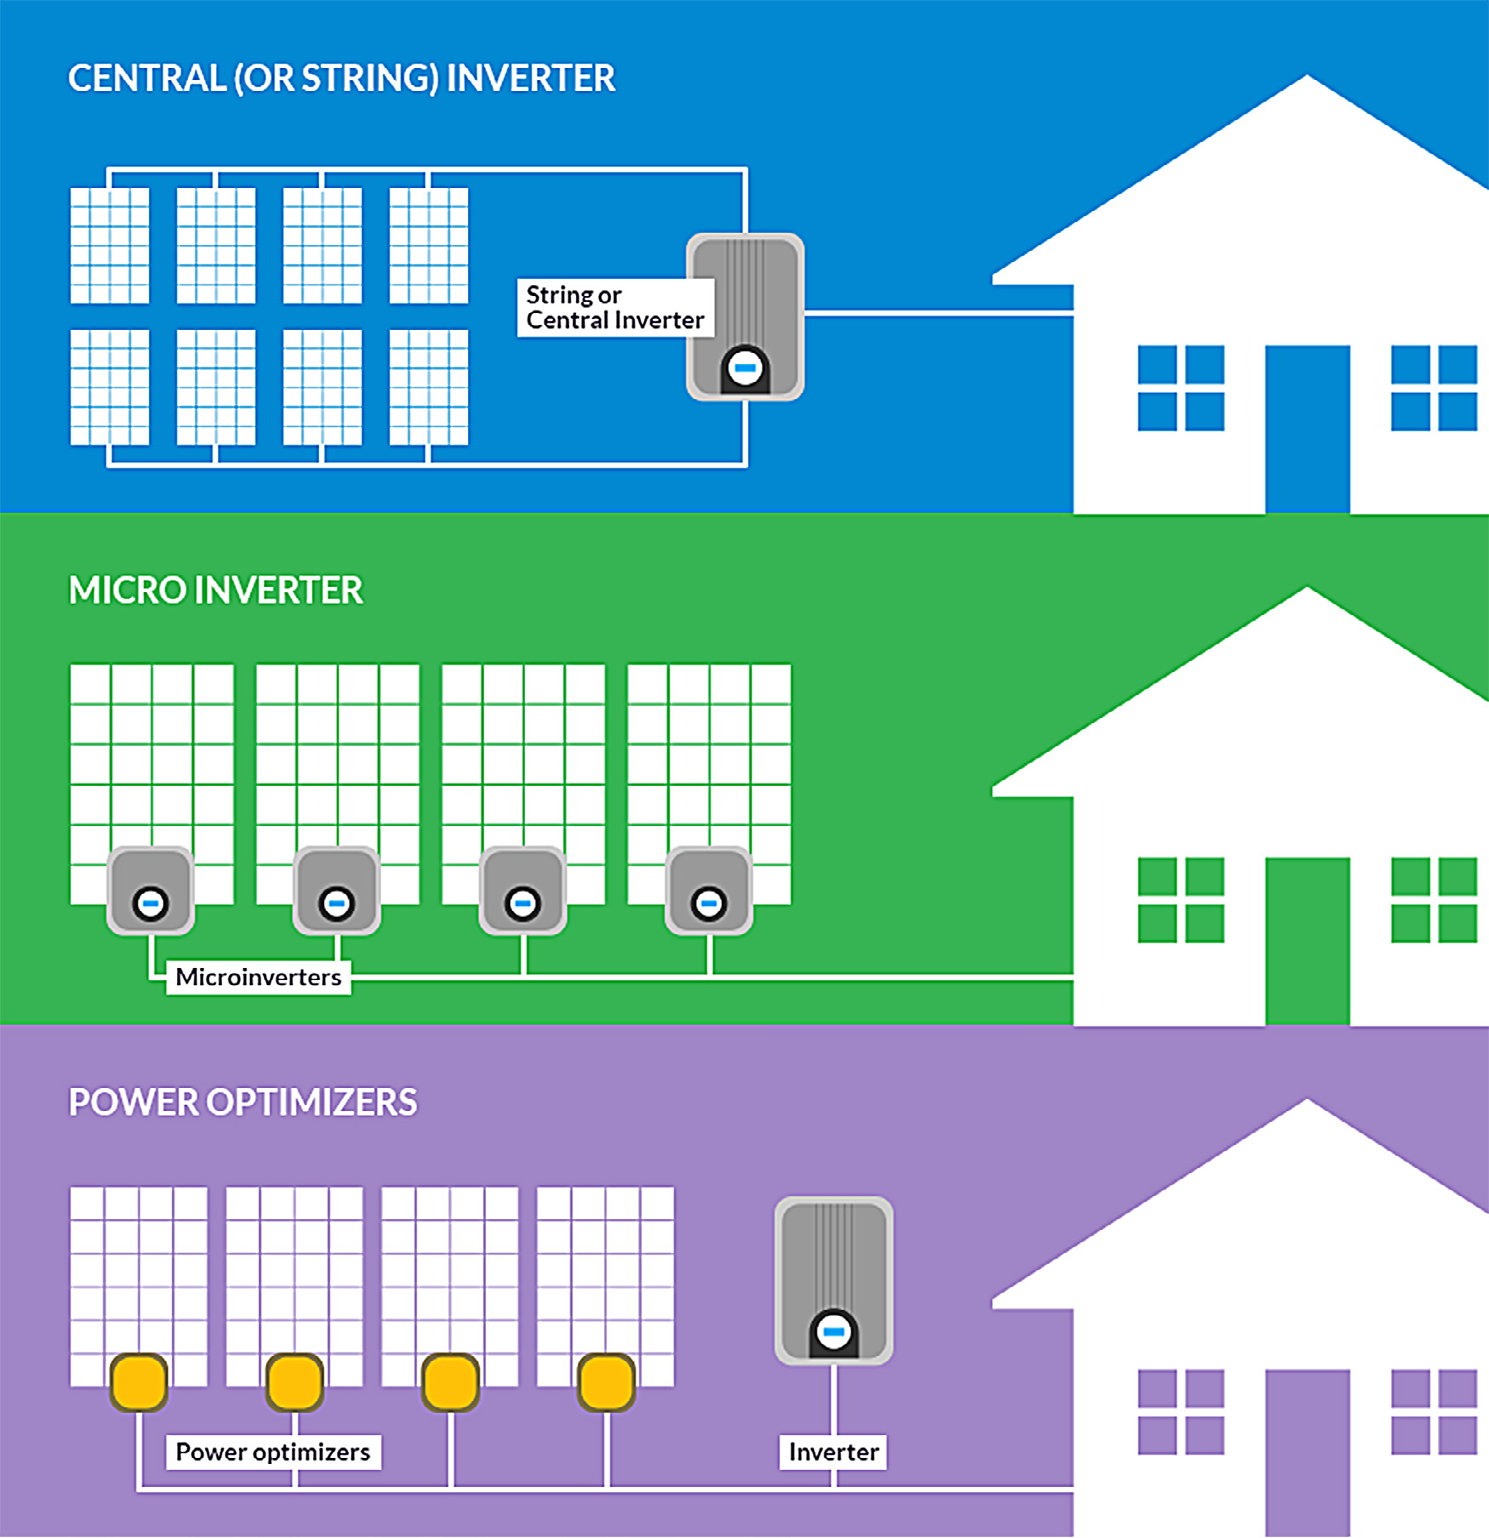
As explained earlier, PV panels produce DC electricity. Inverters transform the DC electricity produced by PV modules into the alternating current (AC) electricity commonly used in most homes for powering lights, appliances, and other gadgets. Grid-tied inverters synchronize the electricity they produce with the grid’s utility-grade AC electricity, allowing the system to feed solar-made electricity to the home and back to the utility grid when the PV system is producing more electricity than the home is using at that moment. Grid tied inverters have a variety of safety features built into them to protect the grid and the utility staff that maintain it. When there is a power outage or power falls outside of established parameters, the inverters will shut down to prevent electricity from flowing onto the grid when the power is out and linemen might be making repairs.
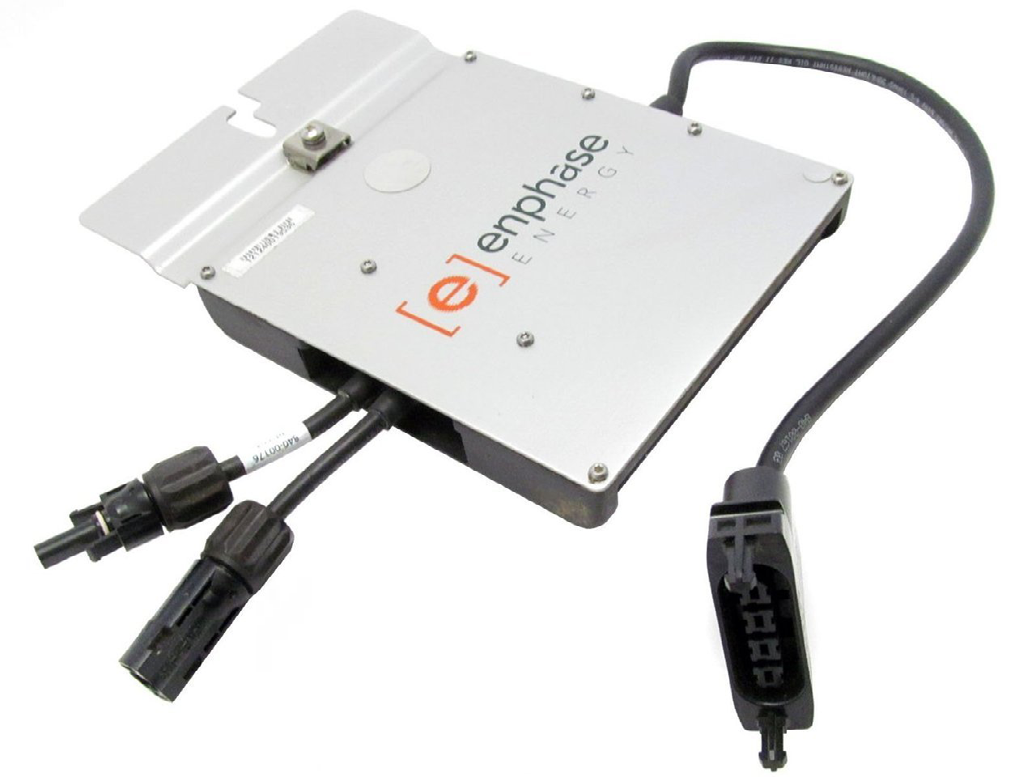
Microinverter — A small weatherproof inverter installed behind each solar module. Converts the DC power generated by the solar panel into AC power right at the panel.
String Inverter — Also called a central inverter. With these, solar panels are connected together into strings and the DC power is wired to a large inverter in a central location. It converts the power for all the modules at once.
Grid-tied inverters have experienced significant improvements over the last decade and can generally be broken into two categories, microinverters and central inverters (sometimes called string inverters).
The first commercially successful microinverters where introduced by Enphase in 2008. A newer Enphase microinverter is shown in Figure 11. There are now many manufactures that produce micro inverters for a variety of situations and system types. They usually attach to the racking directly behind the PV panel.
When a central inverter is used (Figure 12), the PV panels are wired together in parallel and series, and high-voltage DC power is sent to the inverter, where it is converted to AC power. A single central inverter is typically used for a single system unless the PV installation is large. Central inverters are used for off-grid battery-based systems.
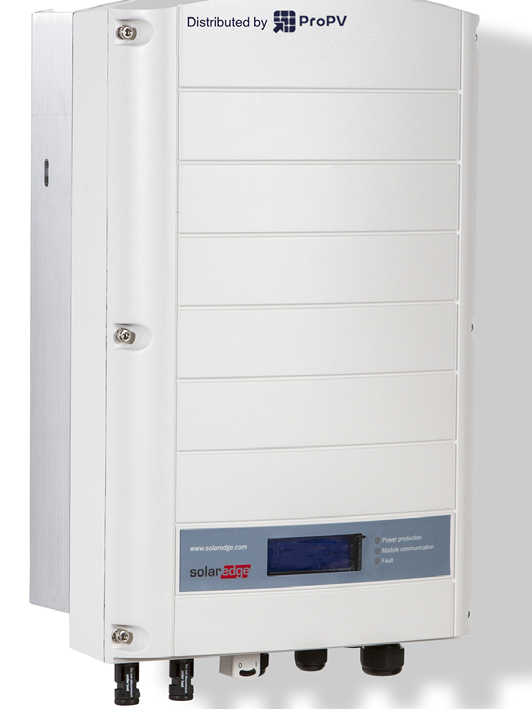
Many grid-tied central inverters also use what are called DC optimizers. Typically, a single optimizer is connected to each panel. The optimizers are a DC-to-DC converter technology developed to maximize the energy harvest from the PV modules. A simple diagram of each inverter type is shown in Figure 13.
Most grid-tie inverters are designed to operate without batteries, but battery-based models also are available. Battery-based inverters for off-grid or grid-tie applications often include a battery charger that is capable of charging a battery bank from either the grid or a backup generator during cloudy weather.
Most grid-intertie inverters are rated for outdoor installation while most off-grid inverters are not weatherproof and should be mounted indoors, close to the battery bank.
Battery Bank
PV panels will produce electricity whenever the sun shines on them, but if the system is off-grid, it will need a battery bank — a group of batteries wired together — to store energy so electricity is available at night or on cloudy days. For off-grid systems, battery banks are typically sized to keep household electricity running for one to three cloudy days.
Grid-intertied systems can also include battery banks to provide emergency backup power during blackouts.
Although similar to ordinary car batteries, the batteries used in solar-electric systems are specialized for the type of charging and discharging they’ll need to endure. Lead-acid batteries are the most common battery used in solar-electric systems. Flooded lead-acid batteries are usually the least expensive, but they need distilled water occasionally to replenish the water lost during the normal charging process. Sealed absorbent glass mat (AGM) batteries are maintenance-free and designed for grid-tied systems where the batteries are typically kept at a full state of charge. Gel-cell batteries can be a good choice to use in unheated spaces because of their freeze-resistant qualities. Li-ion batteries are quickly gaining market share and several manufacturers, including Enphase and Tesla, are designing wall-mounted lithium-ion batteries. These are just a few of the different types of batteries available. Storage is one of the fastest growing aspects of distributed renewable energy generation and will likely revolutionize the grid within a generation.


A lead-acid battery (left) and a lithium-ion battery are shown above. While lithium ion technology is new to the solar industry, deep-cycle lead-acid batteries have been a mainstay of off-grid PV systems for years. Source: www.solarpro.com
Disconnects, Fuses, and Wiring
The DC disconnect is used to safely interrupt the flow of electricity from the PV array for all systems except those using microinverters. It is installed between the panels and the inverter and is an essential component when system maintenance or troubleshooting is required. The disconnect enclosure houses an electrical switch rated for use in DC circuits. It also may integrate either circuit breakers or fuses, if needed.
Charge Controllers
A charge controller is used in off-grid systems. Its primary function is to protect the battery bank from overcharging. It does this by monitoring the battery bank — when the bank is fully charged, the controller interrupts the flow of electricity from the PV panels. Batteries are expensive and must be used according to certain specifications. To maximize their life span, a charge controller avoids overcharging or undercharging them.
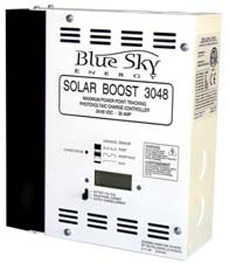
Most modern charge controllers incorporate maximum power point tracking (MPPT), which optimizes the PV array’s output, increasing the energy it produces. Many battery-based charge controllers also include a low-voltage disconnect that prevents over discharging, which can permanently damage the battery bank.
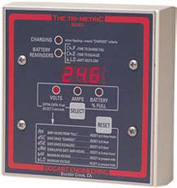
System Meter, AKA Battery Monitor, Amp-Hour Meter
System meters measure and display several different aspects of your solar-electric system’s performance and status, tracking how full your battery bank is, how much electricity your solar panels are producing or have produced, and how much electricity is in use. Operating your solar-electric system without metering is like running your car without any gauges — although possible to do, it’s always better to know how much fuel is in the tank. System metering is recommended for both off-grid and grid-tied PV systems.
Main DC Disconnect
In battery-based systems, a disconnect between the batteries and the inverter is required. This disconnect is typically a large, DC-rated breaker mounted in a sheet-metal enclosure. This breaker allows the inverter to be quickly disconnected from the batteries for service and protects the inverter-to-battery wiring against electrical fires.

AC Breaker Panel and Inverter AC Disconnect
The AC breaker panel is the point at which all of a home’s electrical wiring connects with the “provider” of the electricity, whether it is the utility grid or a solar-electric system. This wall-mounted panel or box is usually installed in a utility room, basement, or garage, or on the exterior of the building. It contains a number of labeled circuit breakers that route electricity to the various rooms throughout a house. These breakers allow electricity to be disconnected for servicing and also protect the building’s wiring against electrical fires.
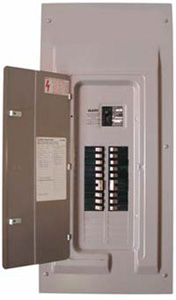
Just like the electrical circuits in your home or office, an inverter’s electrical output needs to be routed through an AC circuit breaker. This breaker is usually mounted inside the building’s main panel, which enables the inverter to be disconnected from either the grid or from electrical loads if servicing is necessary, and it also safeguards the circuit’s electrical wiring.
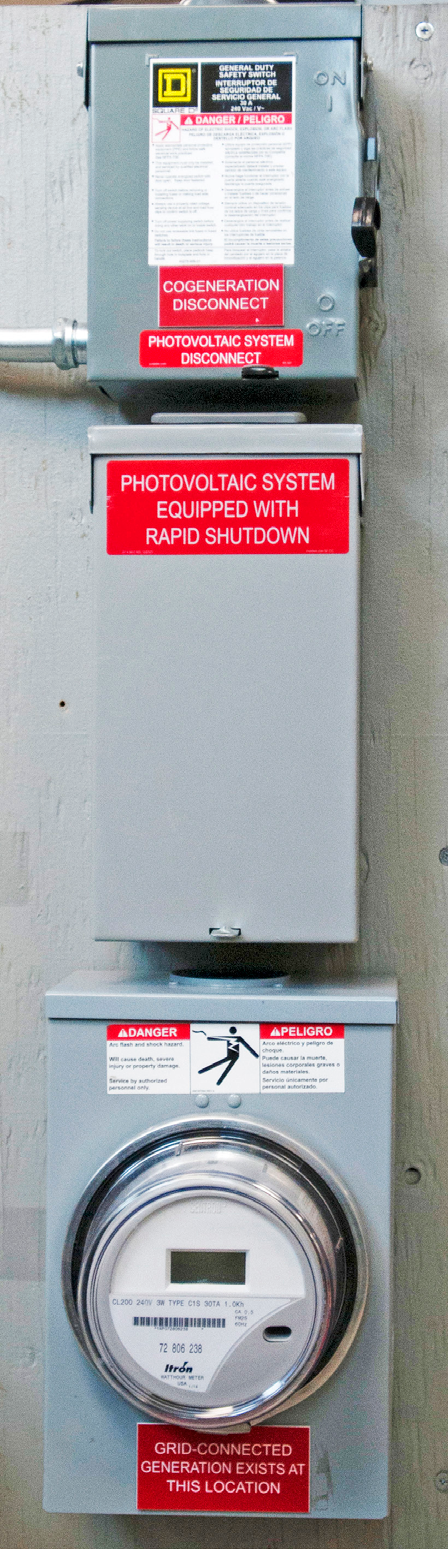
Additionally, utilities will require a lockable AC disconnect between the inverter and the grid that is used by emergency responders or utility personnel. These are usually located in an easily accessible area near the utility KWH meter.
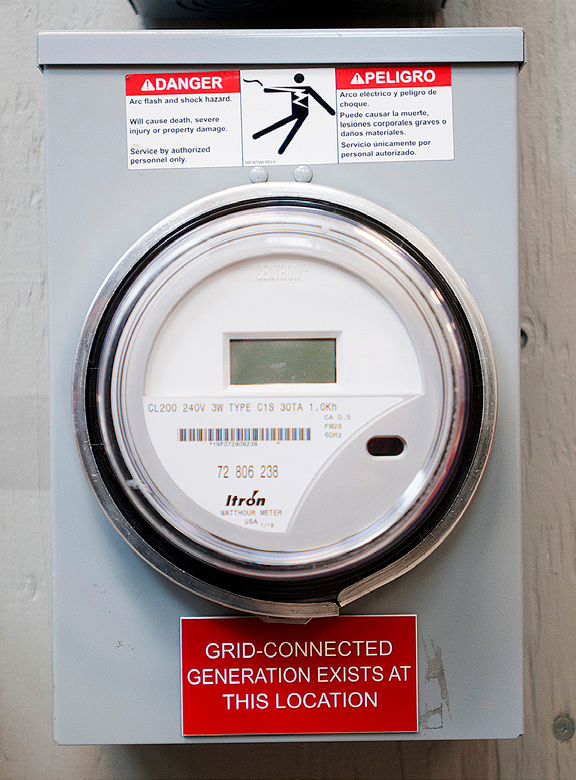
Utility Kilowatt-Hour Meter
Most homes with a grid-tied solar-electric system will have AC electricity both coming from and going to the electric utility grid. A bidirectional KWH meter can simultaneously keep track of how much electricity flows in each of the two directions to monitor how much electricity is being used and how much the solar-electric system is producing. The utility company often provides intertie-capable meters at no cost.
Backup Generator
Off-grid solar-electric systems can be sized to provide electricity during cloudy periods. But sizing a system to cover a worst-case scenario, like several cloudy weeks during the winter, can result in a very large, expensive system that will rarely get used to its capacity. To save money, size the system moderately but include a backup generator to get through those occasional sunless stretches.

Engine generators can be fueled with diesel, gasoline, or propane, depending on the design. These generators produce AC electricity that a battery charger (either stand-alone or incorporated into an inverter) converts to DC energy, which is stored in batteries. A well-designed solar-electric system will require running the generator only 50 to 200 hours a year.
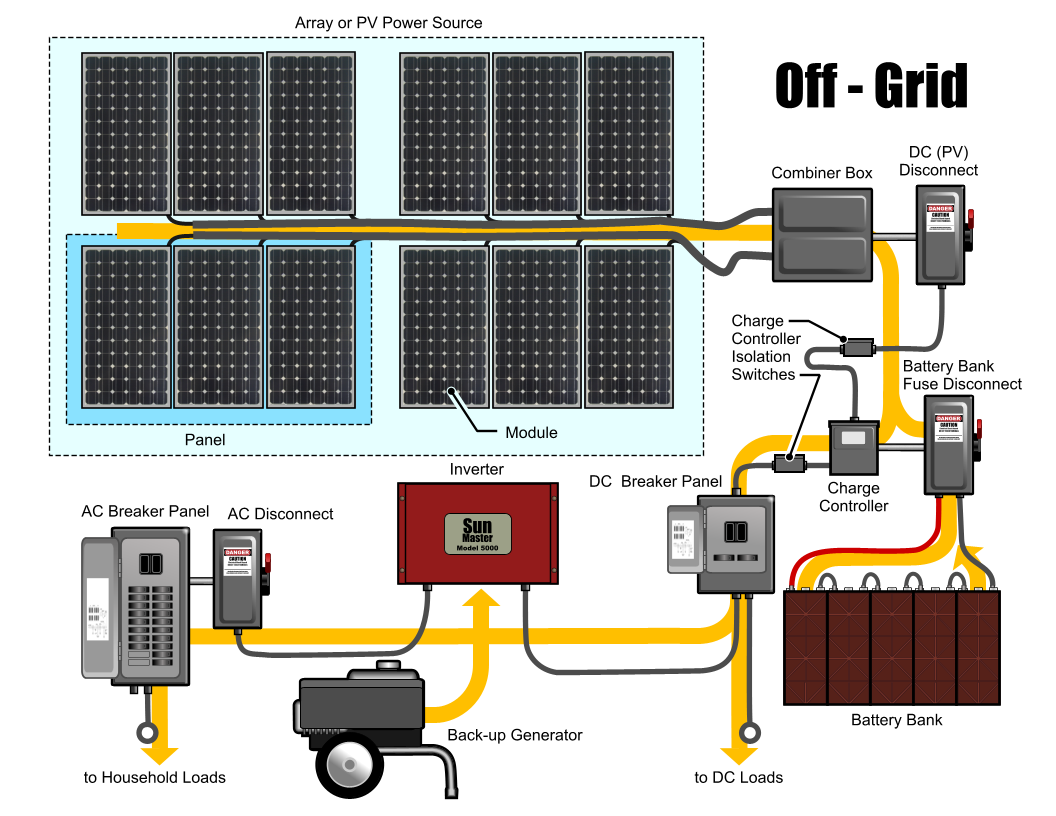
Solar-Electric Systems Demystified
As you can see, the anatomy of a photovoltaic system isn’t that complicated. All of the parts have a purpose, and once you understand the individual tasks that each part performs, the whole thing makes a bit more sense. Figure 14 on the next page shows schematics of completed systems. In addition, solar home tours are held each spring in many cities and towns throughout Alaska. Seeing solar PV systems first hand is great way to learn more about renewable energy systems and meet the people who are using renewable energy in your area.

Current Standards and Codes
The codes and standards associated with solar PV are numerous and are continually evolving and changing. They come from a variety of organizations, including Underwriters Laboratories (UL), the National Fire Protection Association (NFPA), which publishes the National Electric Code (NEC), and the Institute of Electrical and Electronics Engineers Standards Association, which publish the Institute of Electrical and Electronics Engineers (IEEE) standards. The goal of these standards as they relate to solar PV is to ensure the safety of homeowners, installers, emergency responders, and utility personnel.
This section attempts to make some sense out of the alphabet soup of acronyms while briefly describing each of the organizations listed above and how they all fit together. According to the NFPA: “A standard tends to be a more detailed elaboration. A code tells you what to do, and a standard tells you how to do it.” This basic distinction holds true for equipment standards, like UL 1703 or UL 1741, which essentially tell manufacturers how to construct flat plate PV modules and inverters, charge controllers, and combiner boxes and how to test the equipment to ensure product safety.
The most common codes and standards associated with solar PV that readers will encounter include:
- UL 1741: The standard for inverter compliance with grid interactive functions such as anti-islanding in the event of a grid failure.
- UL 1741-SA: A revised version of UL 1741 that incorporates supplement A (thus the SA abbreviation). It includes inverter testing related to anti-islanding, high/low voltage ride through, high/low frequency ride through, ramp rates, and many other factors.
- IEEE 1547: The widely adopted standard for interconnecting a rooftop PV system to the electric grid. Key provisions in IEEE 1547 include voltage and frequency trip thresholds, disconnection, grounding, monitoring, and islanding requirements.
- California Rule 21: A tariff that describes the interconnection, operating and metering requirements for generating facilities to be connected to a utility’s distribution system in California (Rule 21 Interconnection). Best known for the smart inverter requirements. Parts of this tariff will likely be applied in other regions in the future as solar penetrations increase.
- Article 690 of the National Electric Code: This is the main section in the NEC; it details the installation of distributed solar PV systems. One of the most referenced sections is 690.12, the rapid shutdown of PV systems on buildings. It details how parts of PV system must be de-energized when disconnected from the grid.
The following section contains excerpts from “Standards and Requirements for Solar Equipment, Installation, and Licensing and Certification: A Guide for States and Municipalities” was published in February 2017 by Beren Argetsinger and Benjamin Inskeep with funding from the U.S. Department of Energy Sun Shot Initiative and the Clean Energy States Alliance
The National Electric Code
The National Electrical Code (NEC) provides electrical safety design, installation, and inspection requirements. The NEC is sometimes referred to as NFPA 70. It was developed by the National Fire Protection Association (NFPA) and is updated every three years. Alaska is currently operating off of the 2014 NEC. The NEC devotes two of its articles to addressing solar PV systems: Article 690, Solar Electric Systems, and Article 705, Interconnected Electrical Power Production Sources.
Inverter Interconnection Standards
The tables below show some of the inverter disconnect requirements under the various standards. One can see how these requirements have evolved from the Initial IEEE 1547 to the California Rule 21. Many new inverters have grid power quality standards that can be changed with permission from the utility.
Initial IEEE 1547 interconnection standards
(IEEE Standards Association. 1547-2003-IEEE Standard for Interconnecting Distributed Resources with Electric Power Systems; IEEE Std.: Piscataway Township, NJ, USA, 2003)
The Energy Policy Act of 2005 set IEEE 1547 as the national standard for interconnecting rooftop solar PV systems and other distributed generation resources to the grid, and many states and utilities have adopted IEEE 1547 as part of their interconnections standards. Some basic details found in IEEE 1547 are discussed below. Voltage
The system shall detect the effective voltage. When any voltage is in a range given in Table 2, the distributed generation shall cease to energize within the clearing time as indicated. Clearing time is the time between the start of the abnormal condition and the distributed generation ceasing to energize the electric power system (EPS).
| Voltage Range (% of base voltages as stated in ANSI C84.1-1995) | Clearing Times (Sec) |
|---|---|
| V < 50 | .16 |
| 50 ≤ V ≤ 88 | 2.00 |
| 110 < V <120 | 1.00 |
| V ≥ 120 | .16 |
Frequency
When the system frequency is in a range given in Table 3, the distributed generation shall cease to energize the area electric power system within the clearing time as indicated. Clearing time is the time between the start of the abnormal condition and the distributed resource ceasing to energize the Area EPS. For distributed energy resources (DER) less than or equal to 30 kW in peak capacity, the frequency set points and clearing times shall be either fixed or field adjustable. For DER greater than 30 kW, the frequency set points shall be field adjustable.
| Frequency Range (Hz) | Clearing Times (Sec) |
|---|---|
| >60.5 | .16 |
| <59.3 | .16 |
California Rule 21
California Rule 21 is a tariff that establishes new requirements for connecting DR to the California grid. The goal of Rule 21 is to allow increasing amounts of DER to connect to the grid while minimizing the negative effects of the non-firm production. The first phase went into effect on September 9, 2017 in California. Tables 4 and 5 describe the basic voltage and frequency parameters that Rule 21-compliant inverters must meet. We discuss California Rule 21 here because it may very well become the next step for the interaction between distributed generation facilities and utilities where high penetrations of solar PV exist. In Alaska, it can provide guidance in the rural areas where small islanded grids provide a challenging environment for high penetrations of variable renewable resources. The basic breakdown and timeline of Rule 21 is as follows:
- Phase 1 (September 2017) — All new solar projects are required to use a smart inverter that complies with UL 1741-SA and provides basic grid support capabilities for inverters.
- Phase 2 (Late 2018) — Systems must include the capability to communicate with utilities using IEEE 2030.5 (SEP 2.0) protocol.
- Phase 3 (Date TBD) — Harmonizes California Rule 21 requirements with IEEE 1547 Second Edition (2018) and expands grid support requirements for voltage regulation.
Net Metering and Interconnection
Alaska has a diverse array of utilities that come in many different sizes. Utilities on Alaska’s Railbelt are the largest utilities in the state and they generate electricity using a combination of fuel sources that include diesel, natural gas, coal, wind, and hydro. Utility-scale solar may soon be a part of that mix. In the rural areas of the state, most villages generate their power using diesel generators and in some cases wind and hydro power. Because of the range of utilities and grid sizes, the way that customers can connect solar PV to the grid varies a lot from place to place. Customers should consult with their utility to see what the grid connection options are in their area. In this section common billing mechanisms for grid-tied solar PV will be described.
Net Metering on Alaska’s Railbelt
In October 2009, the Regulatory Commission of Alaska (RCA) approved net metering regulations, and the rules became effective January 15, 2010. Net metering allows grid-tied customers in participating utilities who own distributed generation such as solar or wind to subtract the energy they produce from the energy they consume on a monthly basis.
| Region | Voltage at Point of Common Coupling (% of Nominal Voltage) | Ride Through Until | Operating Mode | Maximum Trip Time |
|---|---|---|---|---|
| High Voltage 2 | V ≥ 120 | .16 Seconds |
||
| High Voltage 1 | 110 < v < 120 | 12 Seconds | Momentary Cessation | 13 Seconds |
| Near Nominal | 88 ≤ V ≤ 110 | Indefinite | Continuous Operation | N/A |
| Low Voltage | 1 70≤ V < 88 | 20 Seconds | Mandatory Operation | 21 Seconds |
| Low Voltage | 2 50 ≤ V < 70 | 10 Seconds | Mandatory Operation | 11 Seconds |
| Low Voltage 3 | V < 50 | 1 Second | Momentary Cessation | 1.5 Seconds |
| System Frequency Default Settings (Hz) | Minimum Range of Adjustability (Hz) | Ride Through Until | Ride Through Operational Mode | Maximum Trip Time (Seconds |
|---|---|---|---|---|
| f > 62 | 62-64 | No Ride Through | N/A | .16 |
| 60.5 < f ≤ 62 | 60.1-62 | 299 Seconds | Mandatory Operation | 300 |
| 58.5 ≤ f ≤ 60.5 | Not Applicable | Indefinite | Continuous Operation | N/A |
| 57.0 ≤ f < 58.5 | 57-59.9 | 299 Seconds | Mandatory Operation | 300 |
| f < 57.0 | 53-57 | No Ride Through | N/A | .16 |
When you compare the variable output from a solar PV array to a utility customer’s varying demand for electricity, there will be times when excess electricity is generated (Gipe, 2004). For example, during a bright, sunny day the system will likely produce more electricity than the home or business is consuming at that moment and excess power will flow onto the grid. The situation will be reversed during the hours when there is no sunlight and the PV system is not producing power, and electricity will flow from the grid to the building. With net metering, a customer can essentially bank the excess electricity and consume it at a later time, when the home is consuming more than the PV system is producing. In this situation, the grid functions like a battery. Figure 15 illustrates the net metering interconnection process and shows the main components.
In Alaska, this banking of excess energy production occurs on a monthly basis. In some states it is done on an annual basis. As an example, if a customer’s solar system produces 50 kWh, but the customer consumed 100 kWh, then the customer only has to pay for 50 kWh of energy plus an interconnection fee.
The net metering law states that any energy produced by a renewable energy system in excess of the monthly customer demand will be purchased by the utility at the avoided power cost. This rate varies by utility, but for customers in Southcentral Alaska in 2017, the avoided cost of power was generally around $.05-$.06/kWh. This is the cost of the natural gas the utility burns to produce the electricity. The rest of the cost included in the price of electricity covers the cost of infrastructure, maintenance, administrative costs, regulatory costs, and taxes. In areas of the state that burn diesel fuel to generate electricity, the avoided power cost will be significantly higher than it is in Southcentral Alaska
Net metering is an important part of the grid connected solar PV discussion because it improves the economics for these systems. Without net metering any power that flows from the customer to the utility can only be sold for the avoided power cost. Because customers are allowed to net it on a monthly basis, power produced from solar PV at any time that month, up to their total consumption can be used to offset power that they consumed, essentially valuing that power at the retail rate.
The MEA net metering website (www.mea.coop/ member-services/net-metering/) contains sample applications, FAQs, and case studies. It is an excellent resource for anyone interested in installing solar PV on their home or business.

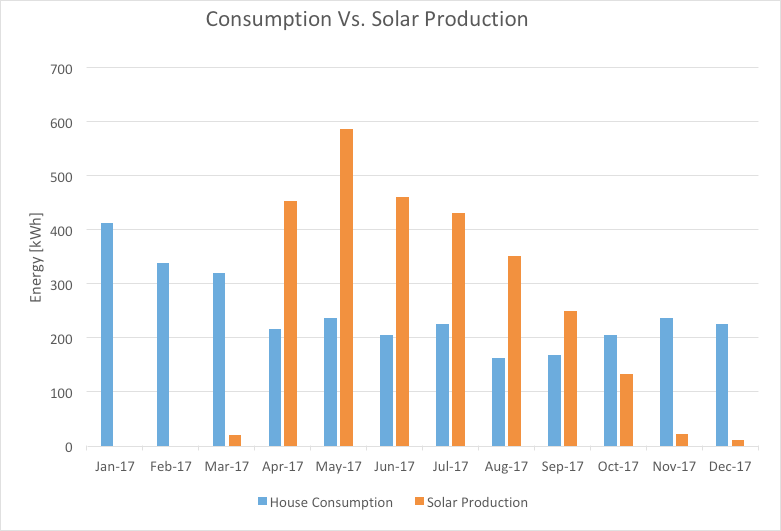
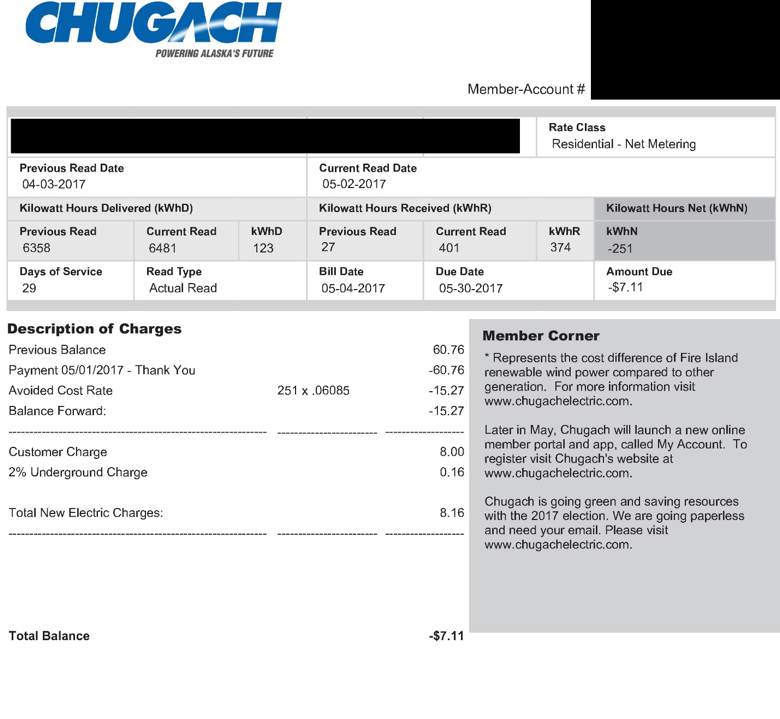
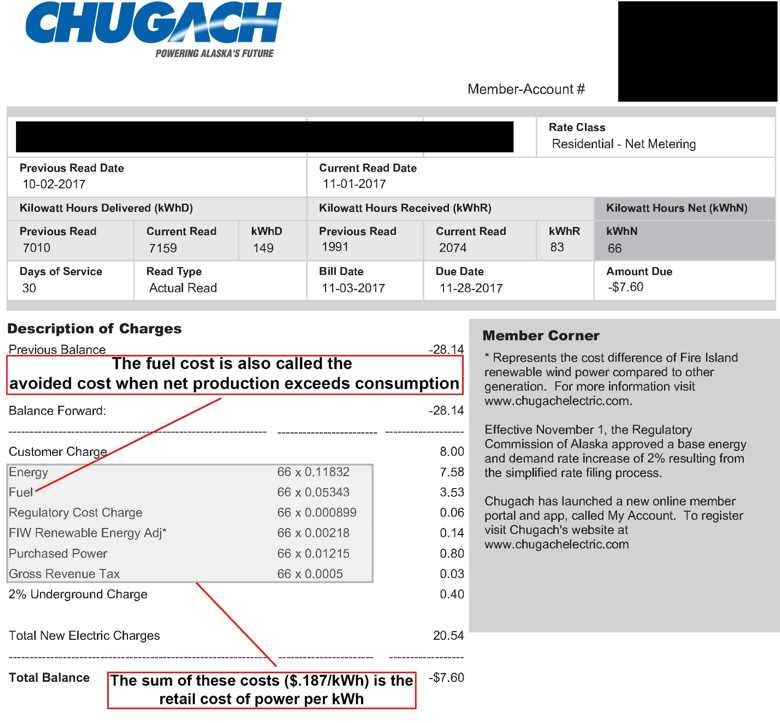
A Net Metering Billing Example
The data in Table 6 show actual monthly solar production and electricity consumption for a home with 4 kW of solar panels located in the Chugach Utility area in Anchorage for 2017. It provides a good example of net metering and billing for the year.
Table 6 shows that the solar system produced more power than the home consumed during the spring and summer months, and the homeowner was able to sell power to the utility at the avoided power cost and accumulate a credit during these months. During the fall and winter months, the homeowner purchased power from the utility. Figure 16 shows a graph of the data from Table 6. Figures 17 and 18 show the utility bills from April, when the homeowner produced more power than was consumed and received a credit from the utility, and October, when the homeowner consumed more power than their PV system produced so they had to purchase the difference from the utility.
The net metering law does not cover all regions of the state or all renewable energy systems. Renewable energy systems with a rated output of 25 kW and less are eligible for net metering. In addition, only electric utilities subject to economic regulation by the RCA are required to offer net metering. Independent systems with retail sales of less than 5,000,000 kilowatt-hours (kWh) are not required to offer net metering. Utilities can cap the allowed net metering on their systems when overall enrollment reaches 1.5% of a utility’s average retail demand for the previous year. Many of the Railbelt utilities are expected to reach this 1.5% cap in about 2021, depending on the pace of installations.
What’s Next for Net Metering in Alaska
As the number of solar PV installations has sky-rocketed over the last couple of years, the question going through many people’s minds is what will happen when the net metering cap is reached. Fortunately, Alaska doesn’t have to reinvent the wheel here since a number of states have had to renegotiate net metering laws as utilities have learned to manage the technical and economic challenges that go with high penetrations of distributed renewable energy on their grid. California, for example, has enacted time of use rates and began requiring that grid-connected solar inverters conform to updated power quality parameters. California’s new Rule 21 tariff that regulates grid-connected solar PV was described earlier in this manual.
| Month | House Consumption (kWh) | Solar Production (kWh) | Monthly Net Consumption (kWh) | Monthly Bill** | Customer Credit |
|---|---|---|---|---|---|
| Jan-17 | 413 | 0 | 413 | $82.34 |
|
| Feb-17 | 339 | 0 | 339 | $69.02 | |
| Mar-17 | 321 | 20 | 301 | $62.18 | |
| Apr-17 | 216 | 454 | -238 | $(5.09) | $5.09 |
| May-17 | 237 | 587 | -350 | $(16.34) | $16.34 |
| Jun-17 | 206 | 461 | -255 | $(22.37) | $22.37 |
| Jul-17 | 226 | 431 | -205 | $(25.64) | $25.64 |
| Aug-17 | 163 | 351 | -188 | $(27.98) | $27.98 |
| Sep-17 | 168 | 249 | -81 | $(24.44) | $24.44 |
| Oct-17 | 205 | 133 | 72 | $(3.48) | $3.48 |
| Nov-17 | 236 | 22 | 214 | $43.05 | |
| Dec-17 | 225 | 10 | 215 | $46.70 |
Assumptions for all bills:
- $.18/kWh retail cost of energy
- $8.00 monthly customer charge
- $.055/kWh avoided power cost
Solar PV Economics and Financing
Dramatic reductions in the cost of solar panels over the last decade have made solar power projects feasible in a wide array of applications on the Railbelt. This cost decrease along with the increase in solar installations is dramatically illustrated in Figure 19. In some parts of the American Southwest the cost of energy produced from solar is lower than the cost from energy produced with fossil fuels. As costs of solar panels and the associated components continue to fall and technology improves, it is likely that this trend will continue to spread.
While the PV panels themselves represent the largest reduction in cost for solar technologies, the cost of other components has fallen. Figure 18 shows how the cost of each component of a solar PV system has fallen since 2010. While the costs in Alaska are not as low as those shown in Figure 20, they will undoubtedly continue to fall. As a general reference, the installation cost for residential rooftop solar in Anchorage is about $3.30/W, while the costs for an equivalent system in rural Alaska would likely run about $5.50/W because of the higher cost of shipping and labor. For a larger, utility-scale system about 500 kW in size the cost would be about $2/W for materials and installation on the Railbelt.
Considerations for solar development in rural Alaska communities receiving Power Cost Equalization
Cady Lister, Alaska Energy Authority
Like all intermittent renewable energy, solar PV energy can cause problems if not properly planned and managed when integrated into a small islanded system, such as those that exist in most rural communities in Alaska. For projects that are not being developed by the local utility, it is critical that developers work closely with the utility to ensure proper integration. Before deciding to move forward with a solar project be sure to call your local utility to find out what rules the utility has about distributed generation on the community power system. For example, a utility may have project size limitations and technical requirements for solar PV generation that is connected to the grid.
Most rural communities in Alaska also receive Power Cost Equalization (PCE) funds to help lower the cost of electricity for eligible customers. This subsidy is an important variable when considering a solar installations. Customers who are eligible for the PCE program should consider the subsidy when evaluating the economics of installing solar to serve their building(s). Eligible customers include residential users (homes) that consume up to 500 kWhs per month and eligible community facilities that receive a subsidy amount based on current Department of Labor population estimates. Details of the PCE program are on the Alaska Energy Authority website.
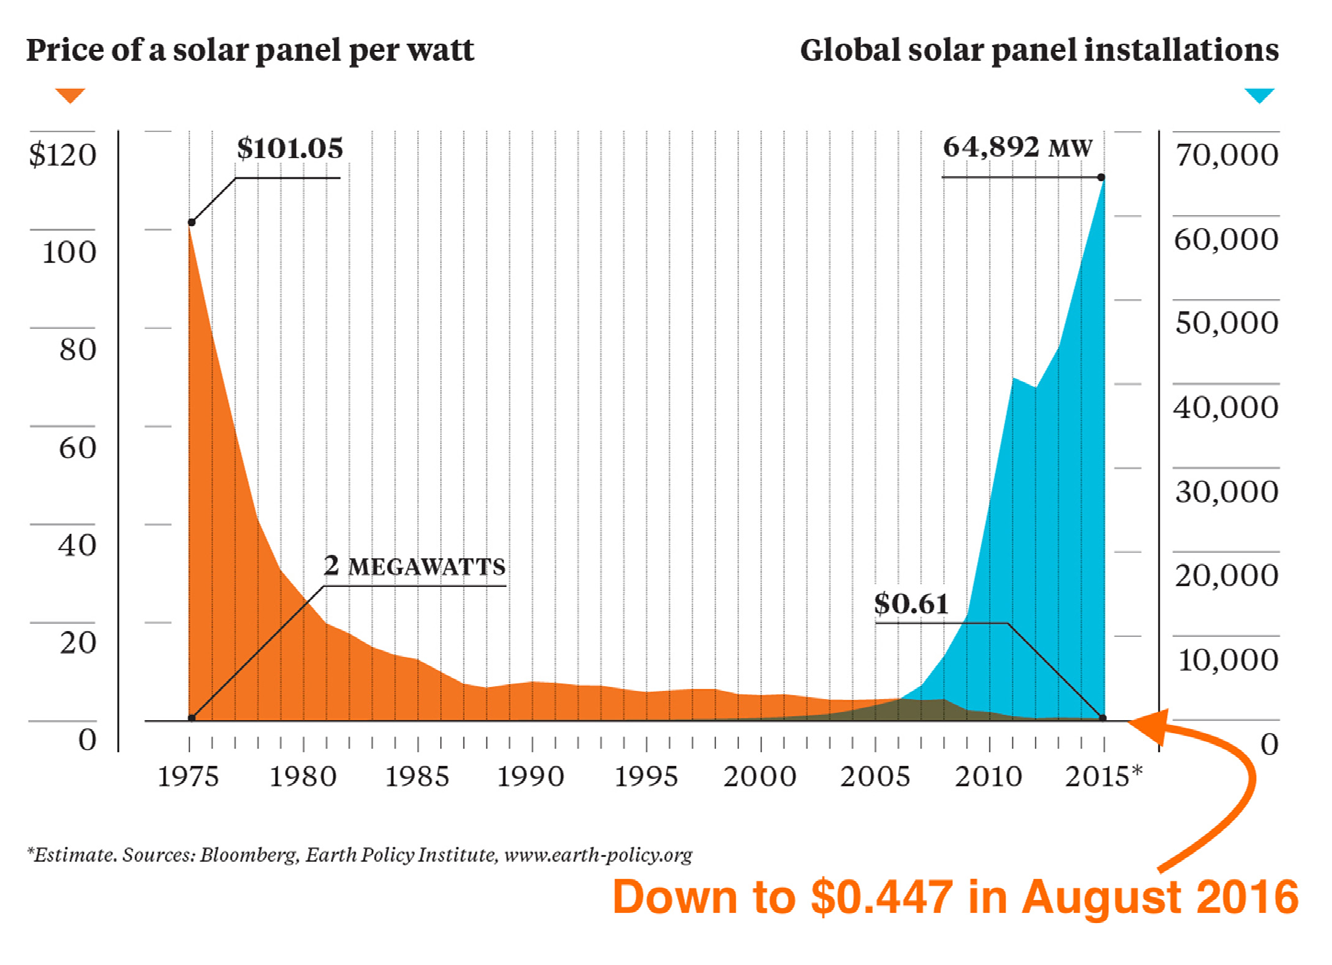
To evaluate the financial benefit of a solar installation in a PCE community, a household or eligible community facility must (1) determine utility rules governing project design, (2) collect energy use data on a monthly basis for at least one full year (the utility should have this historic information), and (3) get cost estimates from at least two different solar installers. Following these three steps will ensure that the installer has good information on rules governing system design, potential to displace purchased electricity, and the cost of installation.
There are a number of ways that financial investment decisions are evaluated, including simple payback, internal rate of return (IRR), and benefit-cost ratio. When making a decision about future values, there is always uncertainty; e.g., the cost of electricity being displaced today and the cost in 10 years will probably be different, but it is difficult to know how different. All of the methods for evaluating project economics make assumptions about the future that may or may not be accurate, but they are good tools for determining how beneficial the project looks based on what we know today and what we think we know about the future.
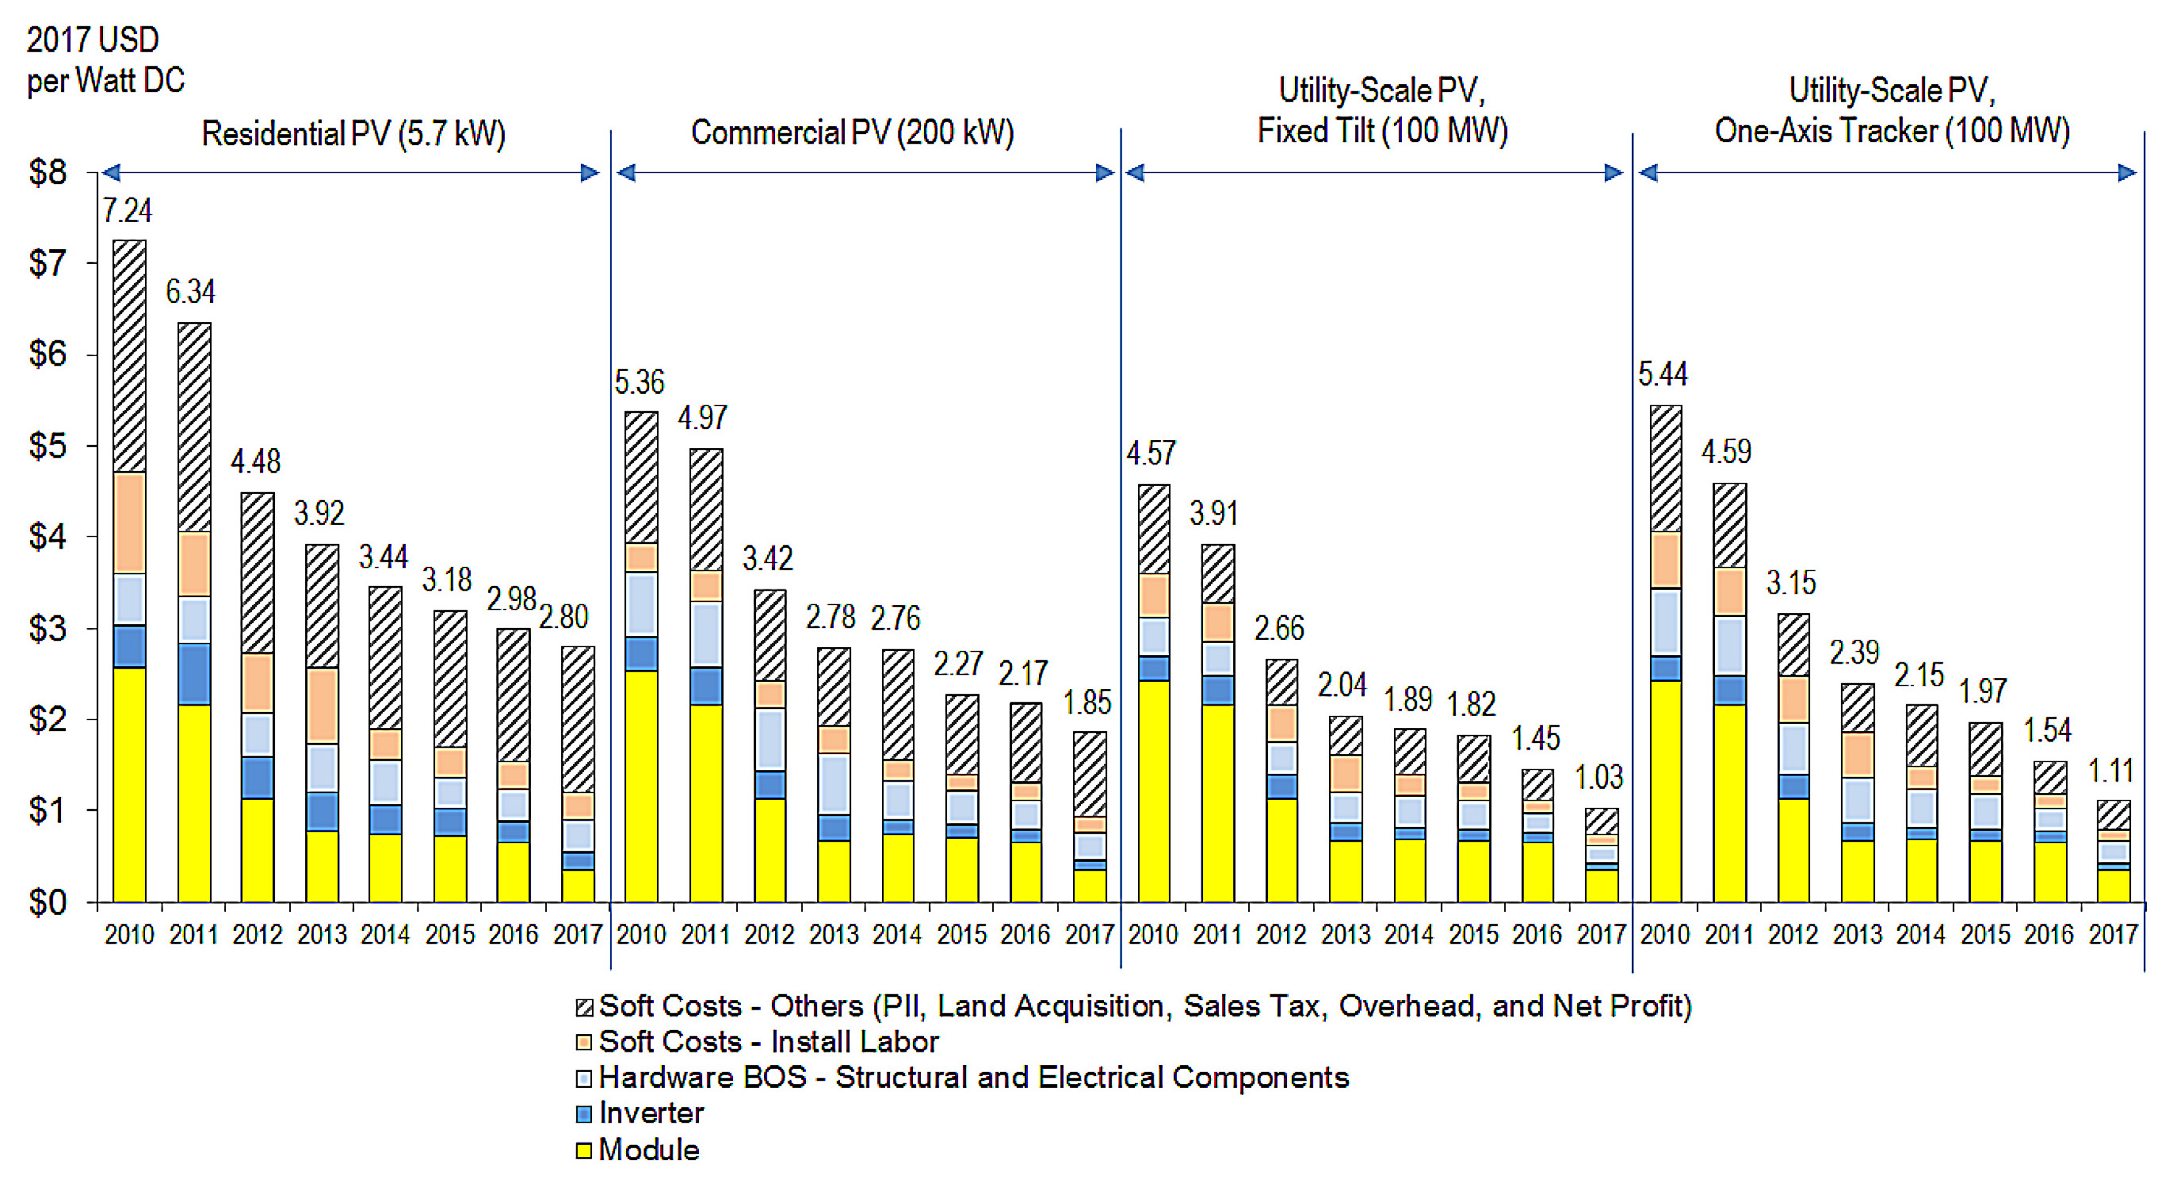
Simple Payback: This metric is simply the number of years it will take to recoup the initial investment based on future cash flow. Cash flow in this case is the money saved through reduced electricity bills. Simple payback does not account for the time value of money.
Internal Rate of Return (IRR): This metric is a percentage that describes the return on the initial investment. In a solar project there is a large cash outlay up front with future payments (in the form of reduced electricity bills) over a period of 25 to 30 years. The rate of return an individual person or entity requires varies but generally speaking, the higher the number, the better. Some investors will compare an investment opportunity to what they would get if they just invested that money in the stock market; others might compare it to a more secure tool like bonds which have lower, but more secure, returns.
Benefit Cost Ratio (B/C): This ratio is calculated by dividing the present value benefits of a project by the present value costs. A discount rate is used to account for the time value of money. B/C ratios of 1 mean that the benefits are equal to the costs, a B/C ratio of less than one means that the costs are greater than the benefits. The higher the B/C number, the better.
A Rural Example of System Economics
There is not very much information about the cost of installing solar in rural Alaska. For the example below, an installed cost of $5.50/kW is used. This cost is about $2 higher per kW than current Anchorage costs, but it is $2 to $3 less than several larger grant-funded installations in rural Alaska. The graph below uses data from 2016 to show the cost of various solar PV systems around rural Alaska compared to their size. Since the price of solar PV has gotten cheaper since 2016, a cost of $5.50/W is sufficiently conservative.
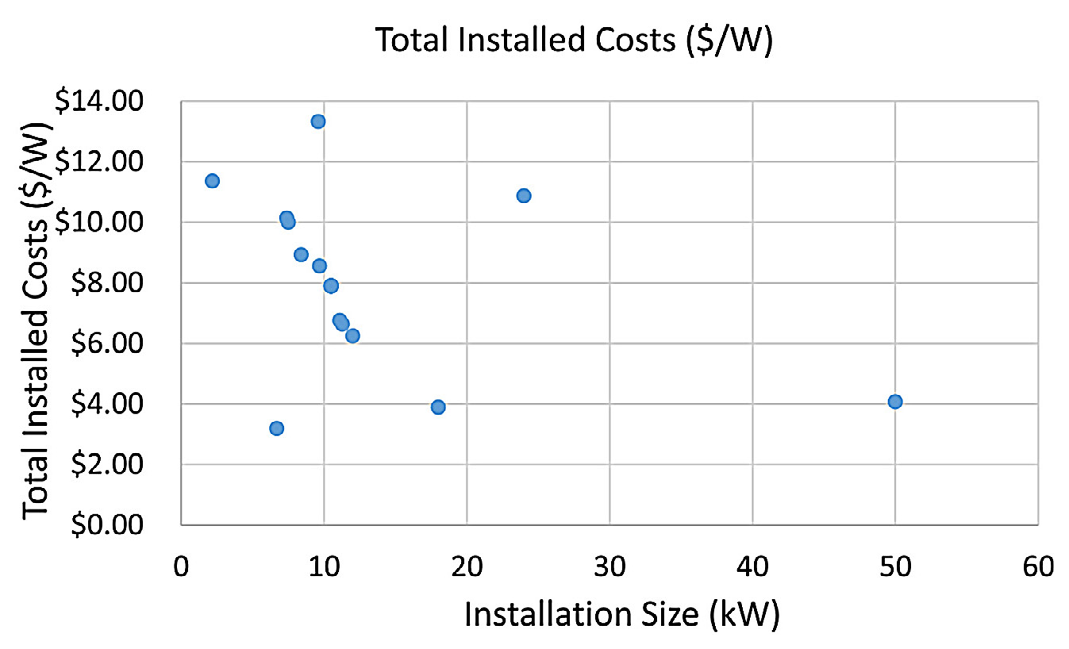
Table 7 shows a hypothetical example of a household solar project in a PCE community. The first 500 kWhs of use each month are eligible for the PCE subsidy, so they are less valuable than usage over 500 kWh. Usage varies by household, making it important to evaluate on a specific case-by-case basis. The example that follows uses the following assumptions:
- Unsubsidized cost = $0.45/kWh (increase 1.5% per year for life of project)
- PCE subsidized cost = $0.23/kWh (increase 1.5% per year for life of project)
- 3 kW solar installed capacity
- 30-year project life, generation degrades at 0.7% per year
- $5.50/W cost = $16,500 total installed cost
- 3% discount rate for B/C calculation
- All solar energy produced is consumed in the home
Solar Economics on the Railbelt
Ben May, Anchorage Solar
A calculation similar to the one above is offered below for a system installed in Anchorage, although some of the assumptions differ. The figures below are very similar to what many installers include in the proposal that they present to the potential customers. You will notice in the analysis below that tax incentives are integrated into the calculation. The current tax credit is 30% until the end of 2019. After this it begins to step down and is currently set to expire at the end of 2022. These credits are subject to change and people are encouraged to check with a tax professional to get the most recent tax credit information.
| Jan | Feb | Mar | April | May | June | July | Aug | Sept | Oct | Nov | Dec | |
|---|---|---|---|---|---|---|---|---|---|---|---|---|
| TOTAL USE (KWH) | 600 | 600 | 500 | 400 | 300 | 300 | 300 | 400 | 400 | 500 | 600 | 600 |
| OVER 500 (NOT SUBSIDIZED) | 100 | 100 | — | — | — | — | — | — | — | — | 100 | 100 |
| SOLAR GENERATION, 3KW | 54 | 163 | 359 | 432 | 420 | 371 | 345 | 254 | 236 | 169 | 69 | 9 |
| UNSUBSIDIZED KWH VALUE | $ 4.30 | $45.00 | $ — | $ — | $ — | $ — | $ — | $ — | $ — | $ — | $31.05 | $ 4.05 |
| PCE SUBSIDIZED KWH VALUE |
$ — | $14.49 | $82.57 | $99.36 | $96.60 | $85.33 | $79.35 | $58.42 | $54.28 | $38.87 | $ — | $ — |
| TOTAL SOLAR VALUE | $24.30 | $59.49 | $82.57 | $99.36 | $96.60 | $85.33 | $79.35 | $58.42 | $54.28 | $38.87 | $31.05 | $ 4.05 |
| ELECTRICITY BILL SAVINGS IN YEAR 1 FROM SOLAR GENERATION — $713.67 | ||||||||||||
| SIMPLE PAYBACK — 22 years | ||||||||||||
| B/C RATIO OVER LIFE OF PROJECT — 0.94 | ||||||||||||
| IRR OVER LIFE OF PROJECT — 2.4% |
Here are the basic assumptions for this analysis, which assumes no monthly overproduction:
- 12 solar panels, 295 W DC capacity each, 3.54 kW total
- Microinverters, 97% efficient
- 30° tilt, facing south
- Minimal shading, 3% loss
- Total loss for soiling, shading, wiring, etc., about 9%
- Utility rate increases at 4% per year (ML&P’s rates have increased at an average of 7% per year for the last 10 years.)
- Panel degradation of 0.7% per year, and replacement of half the inverters between the 10th and 20th year.
Included is a net present value calculation with the resulting IRR for the 25-year life of the solar array. As shown, a homeowner in Anchorage can expect about 8.5% return on investment (ROI) at a good solar site. In places where electricity is more expensive, like the Kenai Peninsula, returns are about 10% to 11%.
Solar Financing 101
Stephen Trimble, Arctic Solar Ventures
One of the quickest ways to increase solar adoption is through easily accessible and low-cost financing. Today, there are numerous ways to finance solar.
Residential Solar Financing
A direct cash payment is definitely the cheapest way to go solar from a capital perspective. Home solar purchased directly with cash in Alaska can pay for itself in 8 to 10 years and continue to generate no-cost energy for decades to come afterward.
Conventional/Home Equity Loans
Several banks offer conventional or home equity loans for solar installation. If you have equity in your home, a home equity loan will have the lowest cost of capital. With any type of solar loan, you own the solar installation and receive the financial incentives, including the 30% federal income tax credit (ITC) and renewable energy credits (REC). Each month, you will pay your lender a predetermined amount that will also include interest. Interest rates typically range from 3.5% to 7% with terms of 7 to 20 years.
Power Purchase Agreements (PPAs) and Leasing
While previously popular and more common in other states, PPAs and leasing are not recommended methods of financing. Leases do not allow you, as the system owner, to utilize the federal income tax credit. PPAs, which are popular elsewhere and have helped to drive solar adoption, are legally and administratively challenged in Alaska. Statutory reform would have to take place for this to become a viable option in the future.
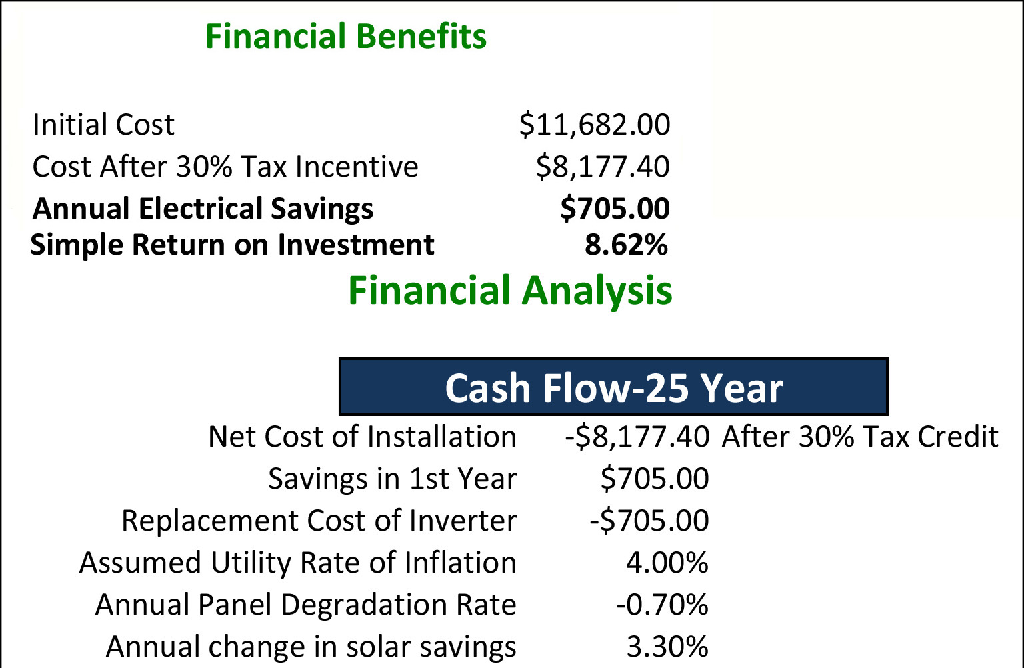

Commercial Solar Financing
Commercial solar lending in the small-to-medium project space has been underused in solar finance. As for residential financing, the best option here is cash payment or a loan. The same 30% ITC applies, but there is also accelerated equipment depreciation, which can account for up to another 30% in federal incentives for businesses considering solar. Businesses outside of Anchorage could also qualify for the 25% USDA Rural Energy for America Program (REAP) grant, a reimbursement grant for solar project expenses. Commercial solar projects that combine these incentives can often see paybacks in less than five years and in some cases, even shorter amounts of time. For more information about the USDA REAP program.
Commercial Property Assessed Clean Energy (C-PACE)
C-PACE programs finance clean energy retrofits through property tax increases. If done by a third party financier in conjunction with a municipality, they offer no-upfront cost, low-interest solar project financing. Adopted as Alaska state law in 2017, C-PACE will likely become available sometime in the next few years after municipalities set up the administrative structures needed to implement and operate the program.
Utility Scale Solar/Community Solar
Community solar is where a central operations and maintenance provider (system owner) pays for a large solar installation and then shares its production with members for a fee. The benefits of serving solar power in this way are that a home or business owner doesn’t need an ideal roof for solar or upfront capital to receive the benefits of solar energy. Utility cooperatives are particularly good examples of community solar as they can provide a benefit to their members by providing clean energy while also operating and maintaining the facility on behalf of participating members. In this scenario, the utility will typically go through its established capital improvement channels to receive financing for a project. Technically, a group of home or business owners could pool resources and develop a co-owned community solar array, but they would be likely be subject to regulatory oversight.
Nonprofits
Nonprofit solar financing has proved to be a difficult market to develop because nonprofits can’t use the federal ITC or the depreciation mechanisms that for-profit businesses can. This has slowed the adoption of solar by nonprofits as the appetite for non-incentivized solar has many potential customers choosing to either wait to invest in solar or to invest their money elsewhere. Solar costs have come down exponentially, but non-incentivized nonprofit projects in Alaska are still typically in the 15 to 17 year payback range and most customers aren’t comfortable with economic payback that takes so long. Some organizations have had success financing non-profit solar through PPAs in other states.
Grid Connected Solar PV in Rural Alaska
Pike et al. (2016) and Alaska Village Electric Cooperative
Most rural areas in Alaska are not connected by transmission lines to the larger population centers. They are what is often referred to as islanded micro grids and they typically generate their electricity using diesel generators located in the village.

During bright days with scattered clouds, distributed solar PV system production can ramp up and down rapidly. Since behind-the-meter systems appear as a negative load to the powerhouse, the rapid changes in net loading can cause power quality issues and damage motors and sensitive electronics. In addition, power quality that goes beyond certain frequency and voltage ranges can cause inverters to shut down and solar production to drop offline, setting up a possible cascading grid failure. For these reasons, it is imperative that customers discuss their potential solar PV project with the utility early in the process.
While net metering is typically not available in rural areas, many rural utilities still allow the interconnection of distributed generation as long as customers follow the process that the utility has established.
The Alaska Village Electric Cooperative (AVEC) operates the power grid in 58 utilities around rural Alaska and it does not allow net metering. The cooperative has an informative article on its website that describes its policy towards customer-owned renewables:
Integration Strategies
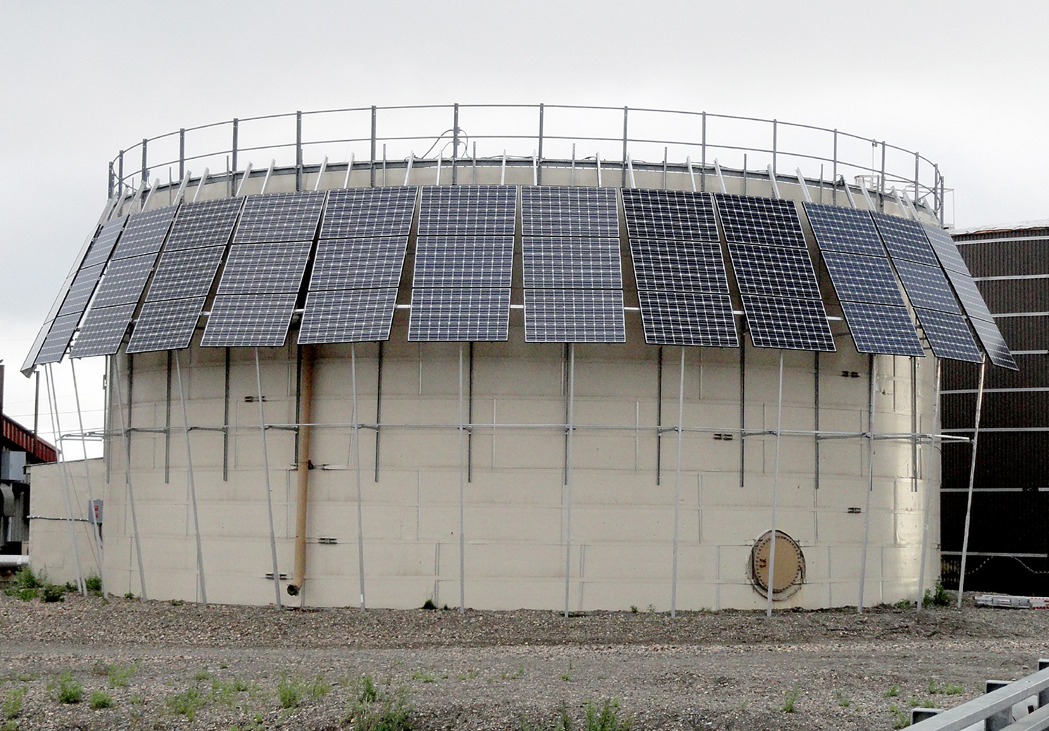
In order to facilitate the integration of solar PV onto small grids, several novel approaches have been used around the state to smooth out large midday production peaks. Often, rather than a traditional south-facing installation tilted around the latitude angle, the panels form a semicircular array or are arranged as two distinct arrays that face east and west. The details depend on the location and type of mounting that is appropriate for the site.
Ingemar Mathiasson is the energy coordinator for the Northwest Arctic Borough (NWAB) and has been the project manager for a number of large PV installations (8-11 kW) on village sewer and water facilities in over a dozen villages in the region. His recommendations for installing solar PV in the Arctic are as follows:
- Realizing that the sun doesn’t rise very high at the Arctic Circle, install fixed arrays at a 60° angle and a semicircular azimuth.
- Choose fixed arrays over tracking because trackers are expensive and have ongoing maintenance. It is better to buy more panels and set them up in a position so that some are always pointed at the sun rather than introduce moving parts into a stationary technology.
- Study the microclimate of the area. Often the clouds buildup in our Interior villages during peak sun and it is advantageous to have panels pointing east and west. As an example, the most significant input of power occurs in Ambler in the late morning from 10 a.m. to 1 p.m.
- Use a very “broad” power curve (from the semicircular array) to minimize the impact on the village power plant.
- Size the behind-the-meter systems so that no excess electricity flows back out onto the grid.
Utility-Owned Systems
In addition to residential and business PV systems, which are typically located behind the meter, there are several examples of Alaska utilities that own and operate PV arrays to help reduce diesel consumption. Examples of such arrays exist in Kaltag, Eagle, and Naknek, and several more are expected to be installed during the summer of 2018. In addition, there is a large solar PV-diesel system located in Coleville Lake in Canada that has the ability to operate in diesel-off mode. Case studies of both Eagle and Colville Lake are presented below. In addition, as different energy storage and controls options are brought to market and continue to get less expensive, the options for utilities to integrate large amounts of variable renewable energy will continue to increase and become less burdensome.
Off-Grid Solar Systems
Designing a Simple Off-Grid System
Say you live near Anchorage, Alaska, and you have a 1 W LED bulb that is designed to work with 12 V DC power. You’d like to use the light to illuminate the street number sign posted at the end of your driveway. You want the light to be on 24/7 so that any time of the day or night someone looking for your place can easily find it. To make things simple, we will not include a sensor to turn the light off during the day, and we will assume you have a good south-facing spot on a wall where you will mount a solar panel at a vertical (90°) angle. In addition, we will assume that this location will almost never be covered by snow.
Considering Wind or Solar for Your Home
Alaska Village Electric Cooperative
We regularly get inquiries from members interested in wind or solar power for themselves. One of their top questions is: Do we “net-meter” consumer-owned generation? The short answer is no. Operating and maintaining an electric utility in our villages is expensive, which is why our rates are as high as they are. We will certainly pay you for your surplus energy, but we pay at our avoided cost—which is basically the cost of fuel that we are saving as a result of receiving your excess generation.
That being said, we will only allow up to a specific amount of non-utility generation to be connected to our system. That amount is far more generous than most utilities permit and equates to 5 to 15 percent of the average electric load in the community. Utilities regulated by the Regulatory Commission of Alaska are required to allow customer-owned generation up to 1.5 percent of their average load. I recently had a residential solar contractor install 12 solar panels on my roof in Anchorage—3.6 kilowatts of total capacity.
During June, I used 462 kilowatt-hours, not much different than a home in one of our communities. My solar panels generated 399 kWh that month, but I was only able to use 194 kWh myself, so the other 205 kWh flowed back into Chugach’s system to be used by others. I used 268 kWh generated by Chugach. Because I am net-metered, I saved $76.57 last month.
Under our co-generation tariff, and using Kiana as an example, had I lived there, my electric bill for 462 kWh would have been $128.22 after PCE. With my solar generation, I would have paid $42.45, thereby saving $85.77—or 12 percent more than I did in Anchorage!
We are asked why we set a limit on customer-owned generation. We have to do that because the intermittent nature of wind and solar power affects neighbors and the distribution system. It also can impact the generation system. Thirty kW of wind in a small system can cause load fluctuations that can damage transformers and generators.
When we install renewables in our communities, we install extremely complex electronic control and dispatch systems to prevent damage while maintaining our diesel efficiency. Even with such control systems, we have to reduce or curtail renewables periodically. We cannot do that with customer-owned generation, so please work with us if you would like to install your own wind or solar generation system.
The meter that serves your home must be programmed to track electricity flowing from you to our system. If a system is installed and connected to the grid without our knowledge and consent, the meter will simply add all energy flowing through it and the customer will be billed the combined kWh as if it were all purchased from AVEC. That would be an unpleasant surprise, and is easily avoidable by talking to us first and following our tariff.
Now that we have a sunny spot to work with, how do we figure out how much power we can generate? Fortunately, the National Renewable Energy Laboratories (NREL) has made 30 years of solar radiation data available for locations throughout Alaska on the PVWatts website (http://pvwatts.nrel.gov/). This data can be downloaded and you can use it to calculate how much power, on average, a particular solar panel or array would output during each month of the year.
The NREL solar radiation data for Anchorage was used to generate the estimated DC energy shown in Table 8. This estimation is based on the following assumptions:
- One 50 W PV module
- 90° mounting angle
- 180° azimuth angle (true south)
- 80% system efficiency
From Table 8 we see that in an average December our 50 W PV system can be expected to produce 852 watt hours. Our LED will need 24 Wh/day or about 720 Wh per month to keep it running 24/7. It looks like a 50 W panel will be adequate for our load.
Case Study: Eagle, Alaska
Eagle is in Interior Alaska, about 190 miles east of Fairbanks. The Eagle powerhouse has three mechanically governed generators ranging in size from 125 kW to 175 kW that are used to cover the community load, which averages about 80 kW. In actuality, loads are lower in the summer and higher in the winter. In May 2015, a 24 kW pole-mounted PV array was commissioned in Eagle. It was funded by the Alaska Power and Telephone Utility and an Alaska Energy Authority grant from the Renewable Energy Fund, Round 6. The total system cost, including civil engineering work and ground preparation, was $212,000, or about $8.83/Watt.
The utility uses its SCADA system for monitoring and data acquisition. It has no controls over the solar PV system. The system uses 96 solar modules that connect to two three-phase string inverters. Instantaneous peak power penetrations have been as high as 43%, with the maximum daily solar energy penetration around 11%. The utility reports that there has not been a significant negative impact on the engines, although this was identified as a potential problem during system design.

Case Study: Colville Lake, Canada
Colville Lake is located at 67°N latitude in northern Canada. The community of 149 people is accessible year-round by air and via ice road in the winter. Until recently, the community relied exclusively on diesel generators to meet the electrical load, which averages 50 kW and peaks at 160 kW. When it was time for a power house replacement, the utility, Northwest Territories Power Corp, began exploring options that included solar PV with battery storage. The original plant was generating power at a cost of about $2/kWh (all costs are Canadian dollars). The new power plant included an integrated solar PV-battery-diesel hybrid system. The major components included:
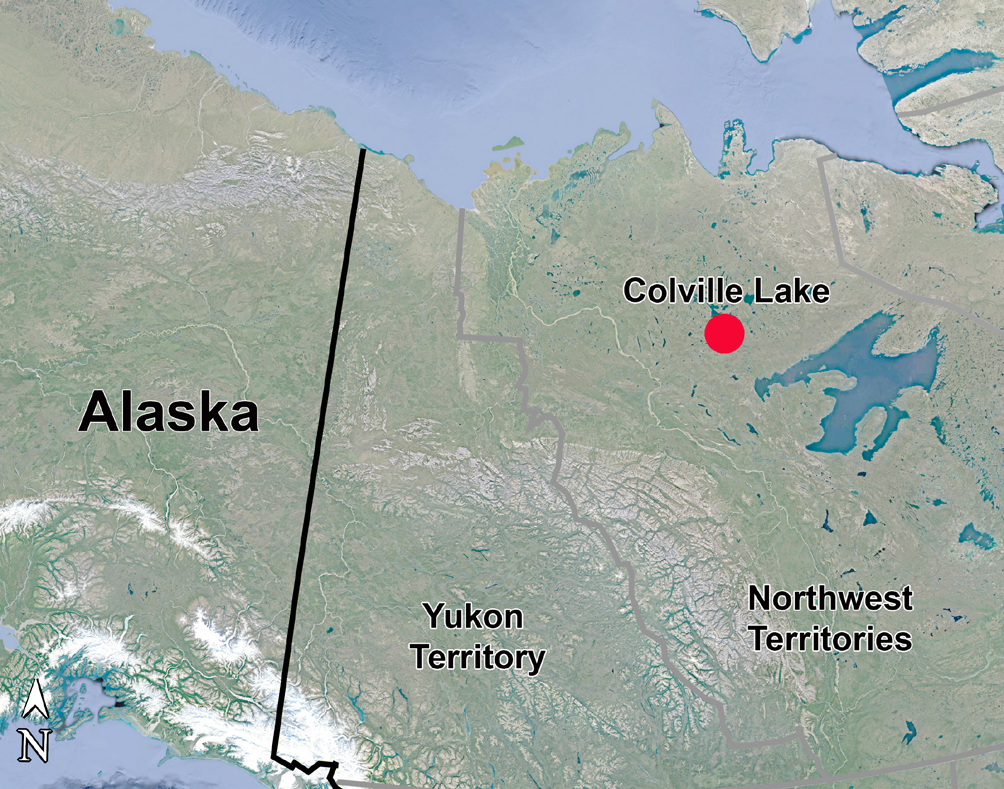
- 3 diesel gensets: G1: 100 kW; G2: 150kW; G3: 100 kW
- 20 kWh Li ion battery
- 136.5 kW solar PV
The final project cost, which included all components as well as utility overhead and interest, was $6.6 million; funding came from federal and territorial governments. The project is expected to offset about 26,000 gallons of diesel per year and result in an annual savings of $75,000. Utility representatives stress that on economics alone, the project isn’t viable, but they view this project as an important proof of concept. They hope to find ways to lower the costs of similar future projects.
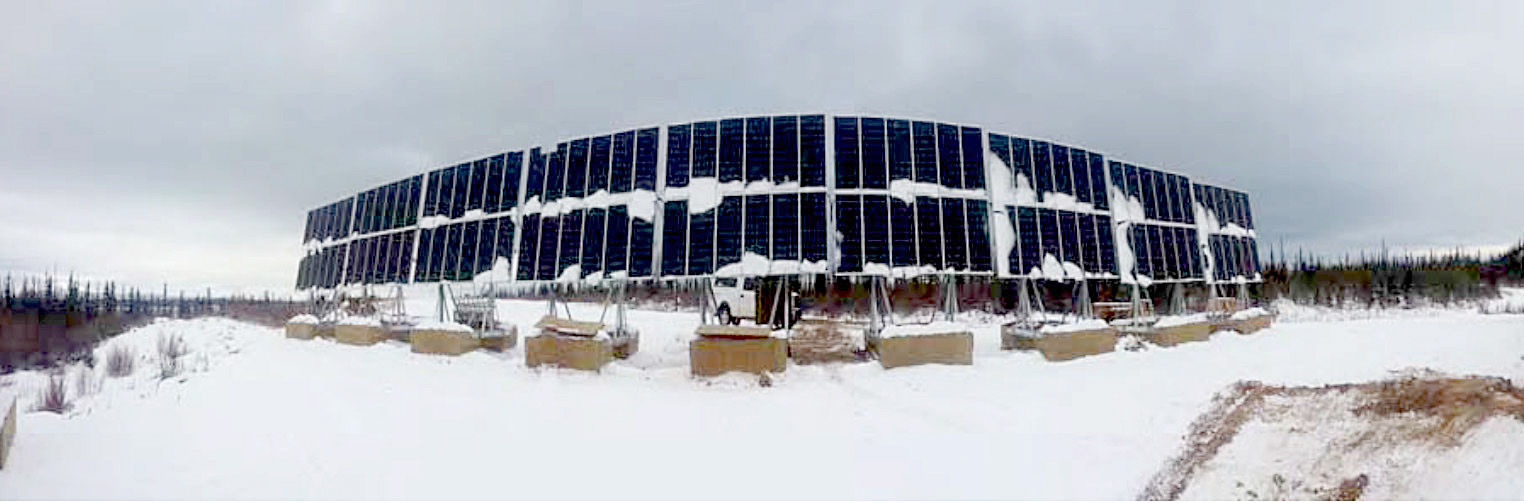
Now we need a battery. To size a battery for a solar electric system with no grid or generator for backup, you need to estimate the number of days in a row you might experience without sun. We really want our light to work all year long, so for this exercise let’s assume we’ll have 10 cloudy days in a row.
| Month | Solar Radiation (kWh/m2/day) | DC array Output (Wh) |
|---|---|---|
| January | 0.80 | 1135 |
| February | 1.96 | 2391 |
| March | 3.11 | 4089 |
| April | 3.30 | 4089 |
| May | 3.55 | 4404 |
| June | 3.33 | 3894 |
| July | 3.20 | 3843 |
| August | 2.88 | 3486 |
| September | 2.76 | 3322 |
| October | 1.71 | 2235 |
| November | 1.38 | 1815 |
| December | 0.61 | 852 |
Batteries are rated in amp-hours so we’ll first need to convert from watt-hours to amp-hours.
24 WH/day x 10 days = 240 Wh
We know that power (watts) = V x A. Therefore:
240 Wh = 12 V x 20 Ah
If we run our light for 10 days straight with no sun, we’ll consume about 20 amp-hours. We could buy a 20 Ah battery that would work for a while, but it would completely discharge after 10 days of no sun. That’s a good way to destroy a battery, so we don’t want to do that. A better level to design for would be a 50% depth of discharge (DOD) .
If 50% DOD is our design criteria we could just purchase a 40 Ah battery and we’d be done; however, our system is located in Anchorage and the battery will live outside all year. We can put our battery in a plastic container to keep the rain and snow out, but it’s still going to stay about the same temperature as it is outside. What if the weather turns cloudy and cold for 10 days?
If you ever pulled a flashlight out of the glove box of your car at 10 below zero you know that batteries don’t work very well when they’re cold. The deep-cycle batteries used in PV systems don’t work as well when cold either. Fortunately, the manufacturers of high-quality deep-cycle batteries like the one you should use in your system provide all the design information you need on their websites.
Looking at Figure 21 we can see that at -10°F (-23°C) the capacity of the battery falls to about 50% of its rated capacity. This means we should de-rate our 40 Ah battery because at 50% of its rated capacity it will only perform like a 20 Ah battery at -10ºF. If we’re concerned about the cold weather performance of our system we could use an 80 Ah battery instead. If we de-rate the 80 Ah battery to 50% we would still have the equivalent of a 40 Ah battery during cold weather.
Sizing a Charge Control for a Single Module System
When selecting a charge control for a small 12-volt system, there are a few things which must be considered. The first is the charging voltage. According to specifications for the Rolls AGM series, our battery needs to charge at 14.2 to 14.4 VDC. Too high a voltage can result in overcharging and a ruined battery. Too low a voltage will cause the battery to charge incompletely. Long-term undercharging will cause it to underperform and shorten its useful life.
The controller must also be able to handle the amperage produced by the PV. We already know our 50 W module produces about 3 amps of current in full sun. For the sake of long-term reliability, we should use a controller rated at 5 amps or greater.
The controller will be housed in a container with the battery, so it should be rated to operate down to -40°F. Temperature affects controller selection another way. When a battery is operating at less than room temperature, it needs to be charged at a higher voltage to charge properly. For this reason we need a temperature compensated charge control. Temperature compensated controllers vary the charging voltage automatically based on an algorithm developed for lead acid batteries. Simply put, the colder the battery, the higher the voltage needed to charge properly. If your battery is not going to live in a heated space a temperature compensated charge control is a necessity and well worth the additional cost. (In hot climates they use temperature compensated controllers to lower charging voltage in order to compensate for high temperatures.)
The rest of the system consists of the wiring, a light fixture, and common hardware items that can be found in your local electrical supply house.
PV Power for an Off-Grid Home
A power system for an off-grid home has a lot in common with our power system for the 1 W LED light, but there are a few differences. We could use the same PV modules and batteries, but we’d just need to have more of them, and the charge control would need more capacity. For practical reasons, we would want to add an inverter to our system. This would allow us to power 120 V AC loads common in a modern home. A fuel-fired generator would allow us to power our loads as well as recharge the batteries during extended periods of limited sunlight.
PV North of the Arctic Circle
Suppose a family living in Bettles wants to design an off-grid home. To design a home-sized off-grid power system properly we must know the loads we’re trying to power. It stands to reason that if we have a smaller electrical load we can use a smaller power system to run it. Energy efficiency is important with any renewable energy system, but it is especially important with an off-grid solar system. Efficiency can save a lot of money because the less energy needed, the less PV needed, and the less battery storage.
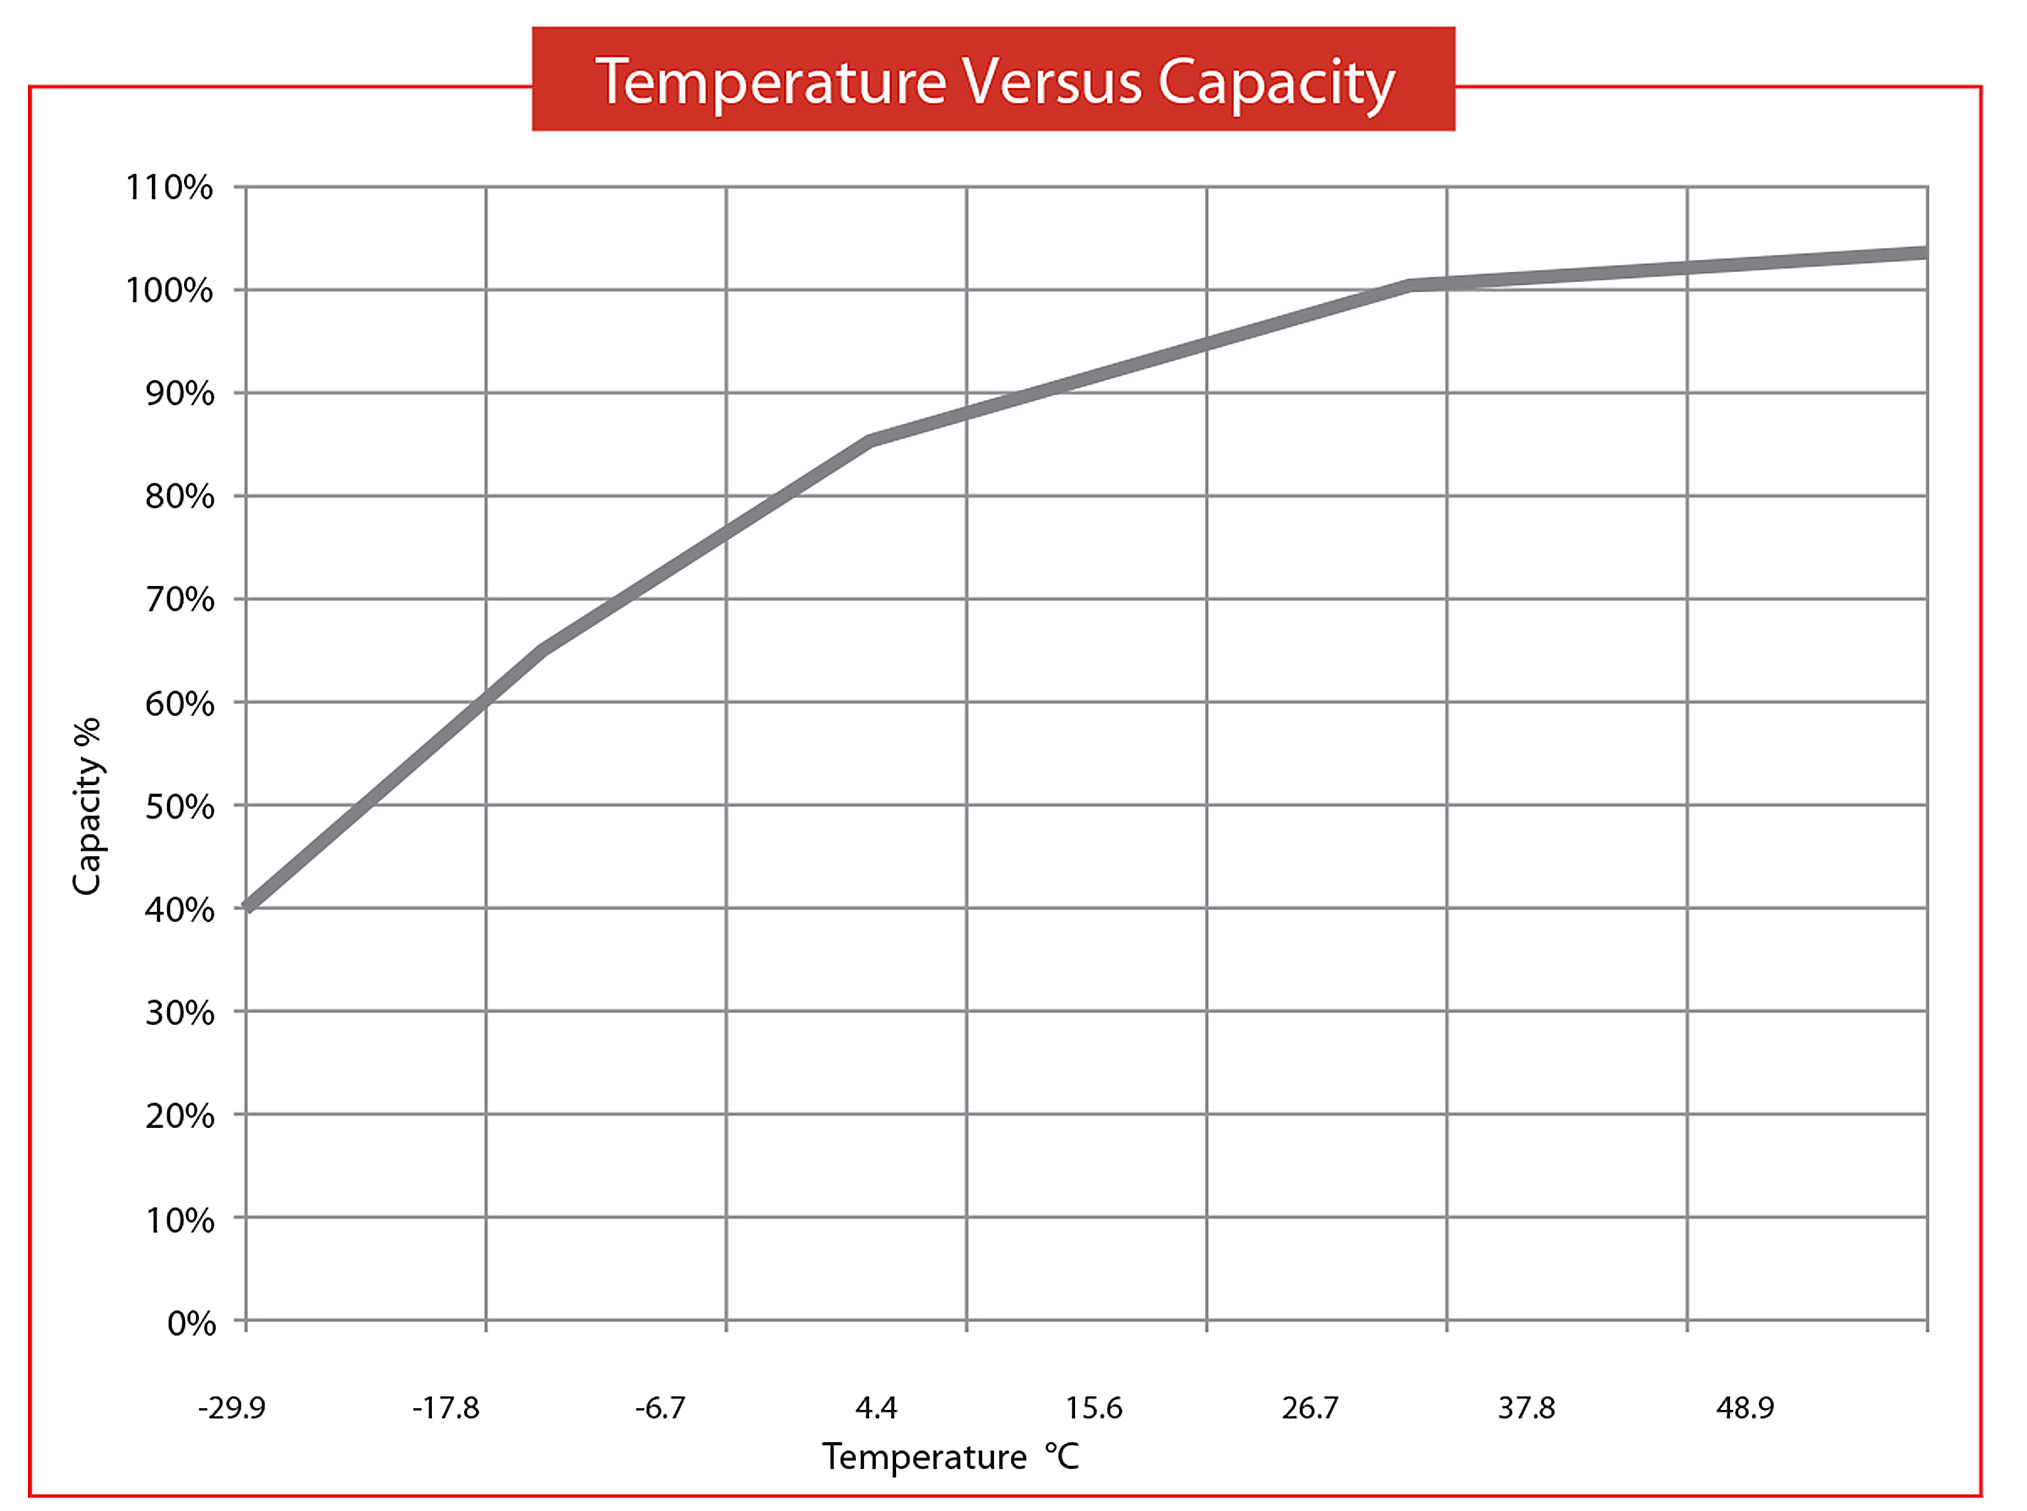
Let’s take lighting, for example. An energy-efficient LED uses about one-fifth the energy of an incandescent to generate the same amount of light. If you can get a job done with one-fifth the power, you’ll need one-fifth the PV array to generate that power and one-fifth the battery bank to store it. This can substantially lower the the cost of initial system as well as the cost of operation during the entire life of the system.
As a general rule, you want to avoid using electric appliances to produce heat for off-the-grid applications. For example, you could use a propane cook stove or an instantaneous propane water heater instead of an electric model. A propane clothes dryer still needs some electricity to operate, but not for producing heat. Depending on your situation, wood may be a viable option for some thermal energy requirements.
Figuring out how much power an appliance uses can be done with a Kill-A-Watt meter available at most hardware stores or by looking online. A good site that has lots of information on computers, boilers, refrigerators, and freezers, etc., is Energy Star.
After doing some research our Bettles family came up with a list of electrical equipment they would need for their home. The chart in Table 9 gives an estimate of the power requirements and time in use for each device listed.
A rule of thumb for the overall efficiency of a battery-based PV system is 70% to 75%. By dividing our total load of 6,559 Wh/day by 0.70 we come to our adjusted total of 9,370 Wh/day for system sizing.
Sizing the Array
If we look at the solar radiation data on PVWatts, we see that Bettles receives little solar energy during winter months but quite a bit during spring and summer. Realistically, it would be impossible to generate all the power this family needs with solar during the winter months, but can we do it six months a year?
Let’s look at a system using 12 175 W modules. This will give us a 2.1 kW array. A pole-mounted array is chosen to keep the panels out of the snow and enable them to be adjusted easily. In places like Bettles, the ability to adjust the array to 90° will help minimize accumulation of snow on the panels during winter, and since this is an off-grid system, we are trying to maximize our solar production.
Table 10 shows the estimated solar system performance for our pole-mounted array.
| Month | Solar Radiation (kWh/m2/day) | DC Energy (kWh) |
|---|---|---|
| January | 0.5 | 32.5 |
| February | 2.3 | 135.2 |
| March | 4.3 | 279.9 |
| April | 5.3 | 333.9 |
| May | 4.8 | 312.5 |
| June | 5.8 | 365.4 |
| July | 5.2 | 338.5 |
| August | 4.2 | 273.5 |
| September | 3.3 | 207.9 |
| October | 1.9 | 123.7 |
| November | 0.8 | 51.7 |
| December | 0.1 | 6.5 |
Batteries
The advantage to having an adequately sized battery bank is that when you have a day or two of no sun and you have some power stored up, you can leave the generator off and enjoy the quiet. If you choose to, you can conserve a bit and wait to do the laundry and vacuuming until more sunshine is available. This will lessen the wear and tear on your batteries and improve long-term performance.
Since this is new construction, we were able to allocate space for the battery bank, inverter, and other electrical hardware in the attached garage. (Note: There is no need for temperature de-rating of the battery bank since it will be installed in a relatively warm space.)
We know we need about 9,370 Wh/ day to run our home. Since we plan to have a generator for backup there’s no reason to have a battery bank with 10 days of storage like we did for our 1 W system. If we want to be able to run our home for two days with no solar input, we would need 18,740 Wh of storage. If we want to design the system to keep the battery state of charge at no less than 50%, then we need a bank that can store at least 37,480 Wh.
| Qty | Electric Load | Run Watts | Start Watts | Hours/Day | Days/Week | Hours/Day |
|---|---|---|---|---|---|---|
| 1 | 19 cu ft Energy Star Fridge/Freezer | 120 | 1300 | 8 | 7 | 960 |
| 1 | Well Pump 1⁄3 hp | 850 | 2550 | 0.25 | 7 | 212.5 |
| 1 | Toyo Type Oil Fired Boiler | 90 | 200 | 8 | 7 | 720 |
| 1 | Heating System Circulator | 75 | 75 | 8 | 7 | 600 |
| 3 | Zone Valves | 5 | 5 | 8 | 120 | |
| 1 | Heating Control Transformer | 10 | 10 | 24 | 7 | 240 |
| 1 | Air to Air Heat Exchanger | 75 | 75 | 12 | 7 | 900 |
| 1 | Television | 75 | 200 | 1 | 5 | 53.6 |
| 1 | Laptop Computer | 50 | 120 | 8 Fluorescent | 7 | 400 |
| 1 | Stereo | 15 | 25 | 4 | 60 |
|
| 10 | Lights | 16 | 160 | 6 | 7 | 960 |
| 1 | Microwave Oven | 1000 | 1200 | 0.25 | 7 | 250 |
| 1 | Vacuum Cleaner | 1350 | 2700 | 0.5 | 2 | 192.9 |
| 1 | Front Loading Washing Machine | 200 | 500 | 1.25 | 7 | 250 |
| 1 | Propane Dryer | 200 | 500 | 1.25 | 7 | 250 |
| 1 | Satellite Modem | 20 | 20 | 12 | 7 | 240 |
| 1 | Power Tool | 1350 | 2700 | 0.2 | 2 | 77.1 |
| 1 | Ni-Cad Charger | 20 | 20 | 6 | 3 | 51.4 |
| 1 | Printer | 40 | 40 | 0.5 | 5 | 14.3 |
| 1 | Coffee Grinder | 150 | 150 | 0.05 | 7.5 |
|
| Average Watt Hours/Day consumed | 6559 |
|||||
| Average Watt Hours/Day to generate (Assuming 70% system efficiency) | 9370 |
*Power usage numbers are for example and are estimates only. Your performance may vary.
A 2 V 915 Ah-rated battery should work, and if we go with a 48 V bank we can wire 24 2 V cells in series and have adequate storage without having multiple battery strings.
Off-Grid Inverters
There are a number of features to consider when choosing an off-grid inverter. First, buy a sine wave inverter if at all possible. Sine wave inverters put out a very clean signal that will power whatever you connect to them. There are less expensive inverters that put out a modified sine wave. They may be adequate for some loads, but if you’re going to be living off the grid you don’t want to scrimp on this. Modified sine wave inverters have been known to cause severe damage to certain types of electrical equipment.
The common input voltage choices for battery-based inverters are 12, 24, or 48 volts DC. The higher the voltage, the more efficient the inverter, so there’s another decision made easy. Most inverters output 120 V AC. Some are stackable, meaning if you need 120/240 (AC volts) you can get it by connecting two or more inverters.
When sizing an inverter, you want to make sure it will be able to run your loads, but it’s also important it be able to start them. Looking back at Table 8 we see that the device with the largest starting load is the vacuum cleaner at 2,700 W. For this reason we choose a 3,600 W 48 V sine wave inverter for our system. This inverter can power a 3,600 W resistive load indefinitely, but it can also provide over 6,000 W for short periods. This allows for the extra power needed for starting things like refrigerators or pumps. The inverter also has an integrated 45 A charger that should be adequate for charging the battery bank.
Generators
The general rule for generators is to buy the best you can afford and use it as little as possible. Gasoline generators are okay, and some of the more expensive ones can be very reliable, but they are built for occasional use only. If you live in a remote location where you want something designed to provide reliable power day in and day out 24/7, there are a number of 1,800 rpm diesel generators in the 8 to 16 KW range that with proper care will provide reliable power for a long time.
The inverter charger we’ve chosen needs about 2.3 KW of generator capacity to charge our battery bank. Since our Bettles family doesn’t have a very large electrical load, they decide to go with an 8 KW diesel generator to complete their system.
References
Dobos, A. P. (2014). PVWatts Version 5 manual (No. NREL/TP-6A20-62641). National Renewable Energy Laboratory (NREL), Golden, CO
Gipe, P. (2004). Wind Power, Renewable Energy for Home, Farm, and Business. Chelsea Green Publishing
Pike, C., Mueller-Stoffels, Marc., Whitney, Erin. (2016). Galena PV Integration Options: Guidance on Technical and Regulatory Issues for Distributed Generation in Isolated Grids. Commissioned by the Alaska Energy Authority under the U.S. Department of Energy RACEE Program
Alaska Village Electric Cooperative,
Colgan, R., Wiltse, N., Lilly, M., LaRue, B., & Egan, G. (n.d.). Performance of Photovoltaic Arrays [Pamphlet]. Cold Climate Housing Research Center. May 2010.
Sanchez, Justine and Ian Woofenden. Aug/Sept 2011. “Home Power: PV Systems Simplified.” Home Power archives (Look for #144 Aug/Sept 2011 issue), Read on Scribd
Whitney, E., and Pike, C. (2017). An Alaska case study: Solar photovoltaic technology in remote microgrids.”Journal of Renewable and Sustainable Energy,” 9(6), 061704.
Solar Thermal Systems
Solar Heating Technologies
Solar thermal technologies typically heat a fluid that is used to transfer heat from the panel to a different location where that heat is needed. Often this is a hot water tank in a solar hot water system. To get a better idea of how solar heating technologies function, each one is described briefly and a sketch is included, if appropriate.
Flat-Plate Solar Collectors
Figure 1 shows a schematic of a typical flat-plate solar thermal collector. This is the most common type of solar collector used today in “active” solar energy systems. Flat-plate collectors convert solar radiation to heat energy. They consist of a flat absorbing surface with several parallel paths running lengthwise through it. A fluid is pumped through the collector.
Sunlight heats the absorbing surface that conducts heat to the fluid.
Flat plates can accept direct or indirect light from a wide range of angles. The absorbing surface is usually made of a material that is a good conductor of heat, such as copper or aluminum. The flat plate is painted or chemically etched black to absorb as much solar radiation as possible. As the absorber warms, it transfers heat to the fluid within the collector, but it also loses heat to its surroundings. To minimize this loss of heat, the bottom and sides of a flat-plate collector are insulated and a glass or plastic cover is placed above the absorber with an air space between the two. The cover permits the light to come through but reduces the amount of heat escaping.
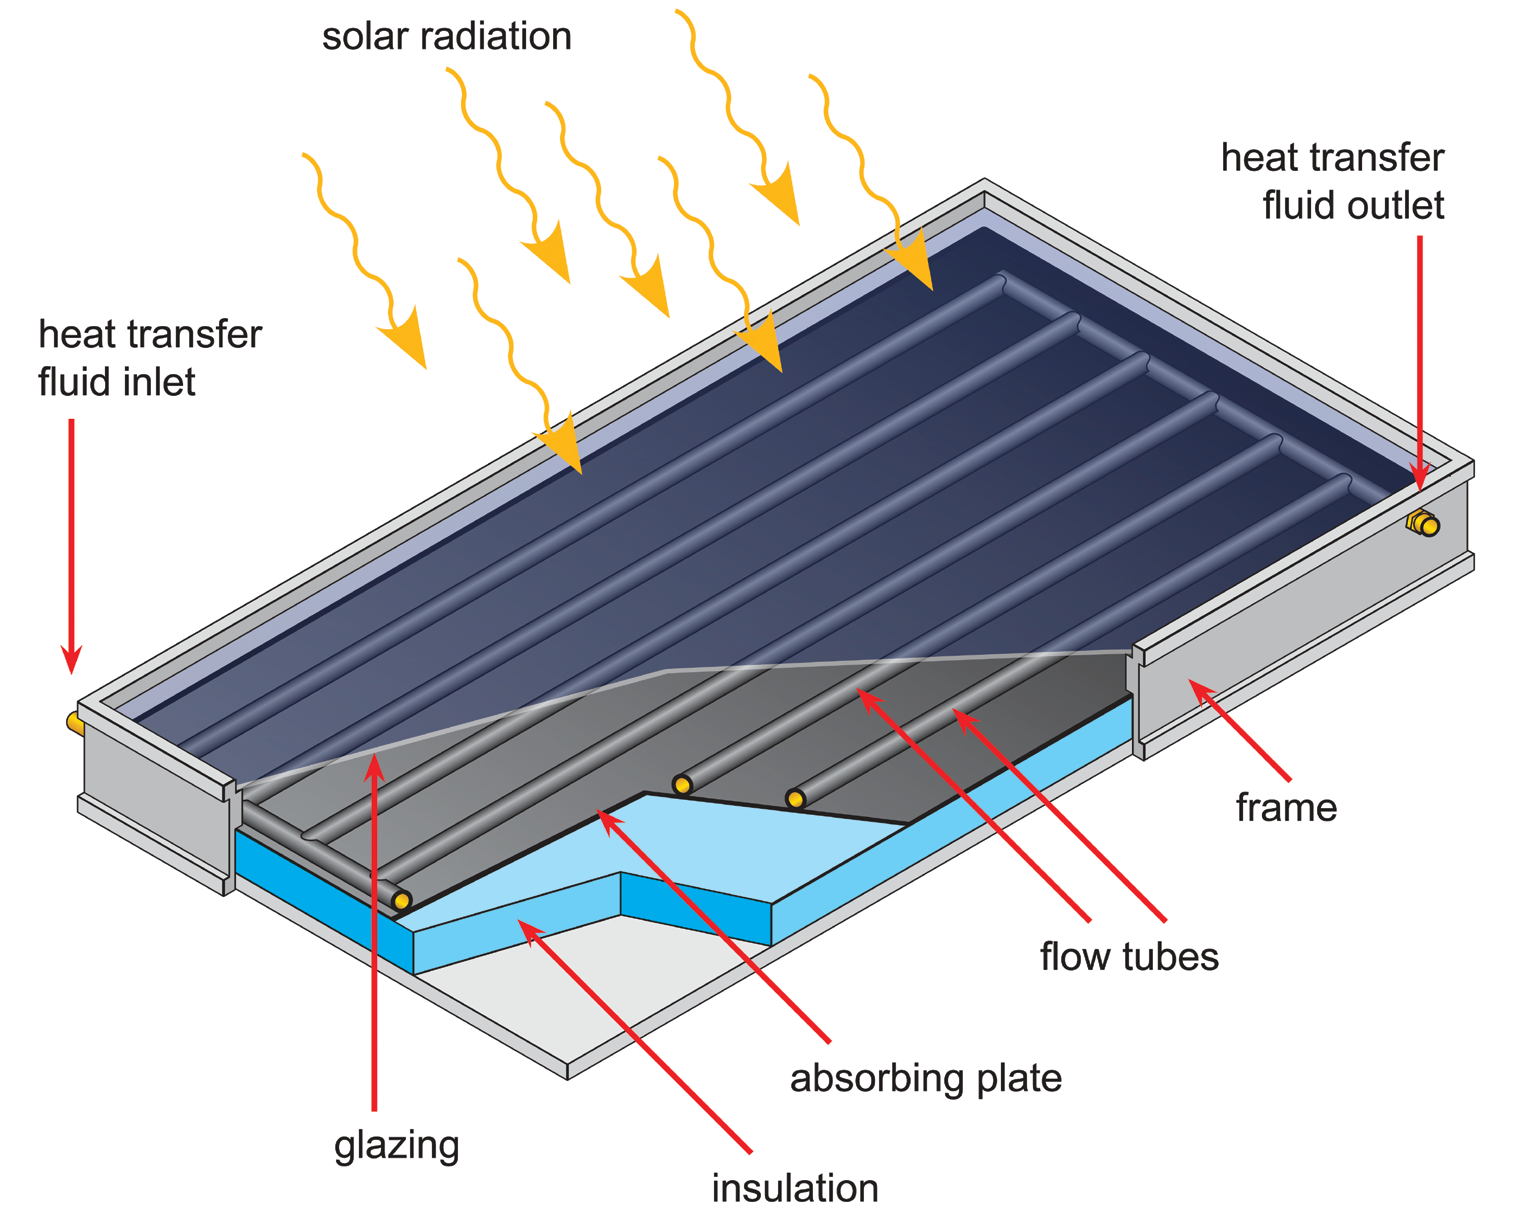
For year-round use, a liquid-type collector must incorporate antifreeze for external circulation and a heat exchange loop to prevent the antifreeze from contaminating the potable water supply in the event of a leak. Liquid-type collectors also function in diffuse light, which is dominant on cloudy days.
Active systems employing flat-plate solar collectors are the most common type used to retrofit homes and businesses because they have greater installation options.
Heat Transfer Fluids (HTF)
Characteristics of good heat transfer fluids:
- High specific heat
- High density and high surface tension
- Low viscosity (it’s thin, not thick)
- Moderately low vapor pressure up to 210°F (93.3°C)
- Low freezing point
- High thermal stability
- Chemically inert and noncorrosive (pH 8.0 to 9.5 range)
- Low dissolved solid content
- Readily available and inexpensive
- Lower power requirements (inexpensive to pump
- Nontoxic
- Easy to install and maintain
Pure, distilled, deionized, or reverse osmosis water is the best HTF fluid on the planet except for the fact that it has a high freezing point. In freezing climactic zones, it can only be used safely in unpressurized drain-back systems that are not open to the atmosphere. Common ethylene glycol, used in cars, meets all requirements, except number 11. Toxic ethylene glycol can be used with aluminum or copper piping. Propylene glycol should only be used with copper pipe. Ethylene glycol is a slightly better heat transfer fluid than proplyene glycol when toxicity is not a concern, but it is limited to space heating systems where there is no possible contact with the potable water. Silicone oil and hydrocarbon synthetic oils used during the early tax credit era proved to be failures. They had serious complicated installation problems, and it was especially difficult to make them leak proof. Ethyl alcohol has been used successfully in some exotic systems, but it has failed to gain wide-spread acceptance because of flammability, toxicity, and inability to be used with commercial or large residential systems. Inhibited propylene glycol/water mixtures are the only fluids that solve all of these requirement in a pressurized system. Most collector manufacturers recommend Dowfrost HD propylene glycol rated to 325°F for one year. This means the fluid could operate for one year at 325°F before becoming acid. Systems using glycol should never be designed to operate over 195°F continuously — over 211°F the glycol will start slowly degrading and will rapidly turn to a glycolic acid after the pH buffers are degraded.
Glycol decomposes rapidly at temperatures over 300°F. These temperatures occur during collector stagnation. Decomposing glycol forms sludge and organic acids, which reduce the heat transfer efficiency and corrode the tubing. If there is no stagnation, fluids circulating through all copper or brass lines and fittings can last ten 10 years before they must be changed. The fluid must be replaced anytime there has been a no-flow condition in full sunlight. Aluminum pipe is not recommended, even with ethylene glycol, because of pitting problems with the piping if the fluid becomes acidic. The reason you change glycol fluids in your car every year is not because of loss of freeze protection. It is because the fluid’s buffers are broken down by mixing with so many different metals in the radiator loop. This makes the fluid acidic enough to start corroding the metal tubes in the radiator (Lane, p.17).
Freeze Protection Commandments
Freeze protection is a major concern for the solar contractor, even in areas with only one freeze a year. Freeze protection has nothing to do with how many freezes there are each year. Freeze protection must include ALL LINES GOING THROUGH THE ATTIC AND UNCONDITIONED SPACES. A solar collector can freeze at 42°F (6°C) outside temperature because of night sky radiation on a crystal clear night if the temperatures are held long enough. Active open-loop and thermosyphon systems with potable water in the collectors should only be used in areas that average less than one freeze a year. Absolute freeze protection demands no human interaction or electrical power. Murphy’s Law covers the following: Human beings will not remember, or be available, to activate manual drain valves or other devices during a freeze. Electricity will not be available to activate pumps during a freeze. Freeze sensors or controllers will not activate freeze protection during a freeze and/or utility power will not be available because of large scale or localized rolling blackouts. The less common the freeze, the more likely the utility will have a power blackout as a result of its inability to handle extraordinary peak demands. Freeze protection must be 100% reliable and dependent only on the laws of physics. This means only active, indirect systems like drainback (not draindown) or closed-loop glycol systems with heat exchangers that separate the heat transfer fluid (HTF) that goes through the collector from the potable water can be relied on to be freeze-proof. Closed-loop glycol and drainback systems can have freeze problems if they are not properly installed and the system components malfunction (Lane, p.3).
Evacuated Tubular Collectors
In Arctic conditions, it is an advantage if the collector design can utilize solar radiation from all directions. It is also an advantage if the collector has a low heat loss so that as little as possible of the absorbed solar radiation is lost to the surroundings. Furthermore, the collector must be able to utilize ground-reflected radiation, as the snow on the ground has a large reflection coefficient. Evacuated tubular collectors can be designed to fulfill these demands. There now exist two types of evacuated tubular collectors:
Heat pipe-evacuated tubular collectors consist of cylindrical evacuated-glass tubes that are connected to a condenser/heat exchanger unit. Inside the evacuated tubes are the absorber fins, with selective coatings on the surfaces and with a heat pipe that contains the working fluid. The working fluid evaporates when the absorber is heated by the solar radiation. The evaporated fluid rises in the pipe and condenses on the condenser in the heat exchanger unit and energy is transferred to the solar collecting fluid, which is pumped through the condenser/heat exchanger unit. When the working fluid in the heat pipe condenses, it drops down in the heat pipe again and the whole process is repeated if the temperature is high enough. Figure 2 shows an evacuated glass tube with a heat pipe.
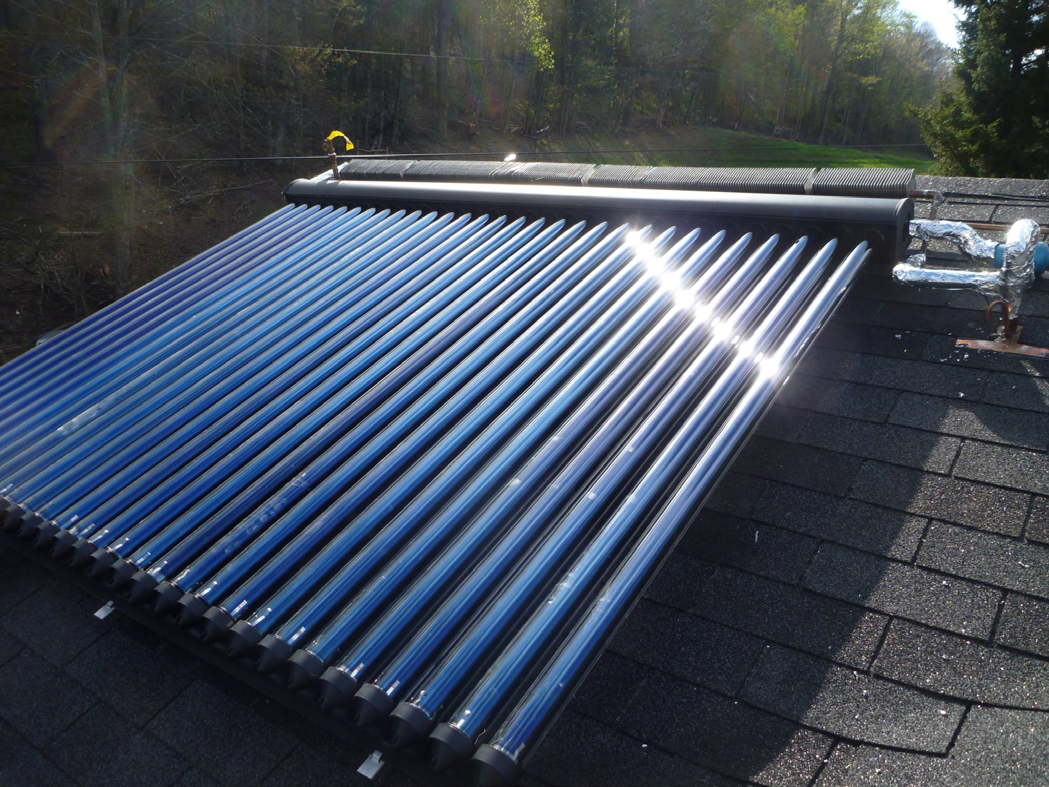
All-glass evacuated tubular collectors are designed in a different way. They are based on double-glass tubes with the evacuated space between the glass tubes (Figure 3). The outside of the inner glass wall is treated with an absorbent coating and works as the absorber. When the tube is exposed to solar radiation, the inner glass tube gets very hot. The heat can be transferred from the inner glass tube to the solar collector fluid in different ways: The solar collector fluid can flow directly inside the inner glass tube or the solar collector fluid can flow in a metal pipe that is in good thermal contact with the inner glass tube.
Evacuated tubular collectors are suitable for Arctic conditions because:
The collectors have a low heat loss coefficient. The evacuated space in both types of evacuated tubular collectors limits the heat loss from convection and conduction. Therefore, the heat loss from evacuated tubular collectors is lower than the heat loss from traditional flat-plate collectors.
The collectors can utilize solar radiation from all directions. All-glass evacuated tubular collectors have cylindrical absorbers, and in heat pipe-evacuated tubular collectors the absorber fin can have a curved shape, which follows the shape of the glass tube.
- The curved/cylindrical absorber shape utilizes the ground-reflected radiation better because it can collect it from nearly 360° around itself.
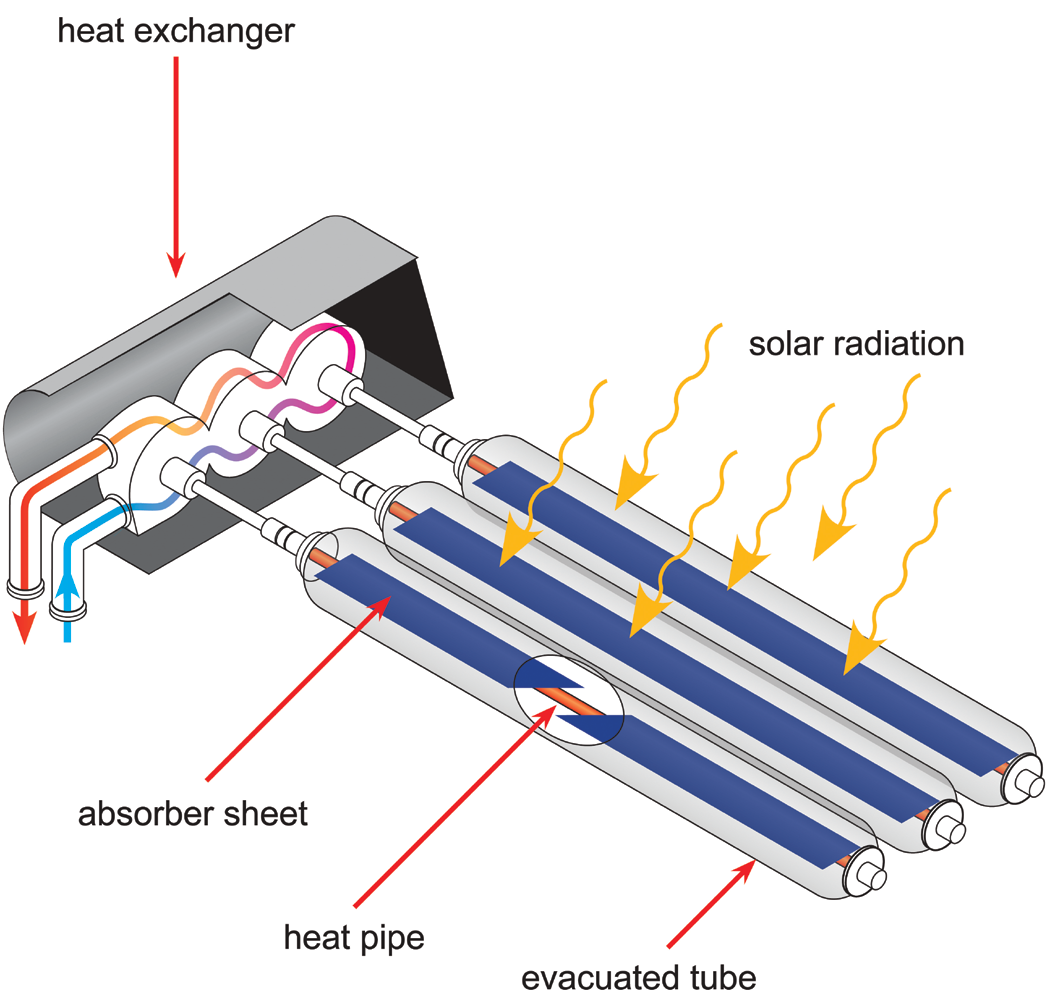
Vacuum Tubes or Flat-Plate Collectors — Shedding Ice, Snow, Frost, and Hail Issues
Research in Germany presented at the 2nd European Solar Thermal Conference in 2005 confirms a conceptual weakness in using vacuum tube collectors for hot water and space heating between October and March. Vacuum tubes defrost or melt frost and snow extremely slowly as a result of their efficient vacuum. Another problem is that snow and ice get “stuck” between the vacuum tubes and the mounting hardware. Snow or frost can easily melt off and/or slide down the glass of flat-plate collectors. The research and pictures below from the Center of Excellence for Solar Engineering at Ingolstadt University in Bavaria reveals why, at temperatures below freezing, flat-plate collectors generated higher yield per gross area despite their lower nominal efficiency during the winter. The evacuated tubes and flat-plate collectors pictured below were flush mounted at a tilt of 33° on the same roof. For high-latitude applications like Alaska, the use of vertical wall mounting for solar collectors of all types becomes an obvious fail-safe option. The efficiency of the vacuum works against defrosting the glass or eliminating snow. Frost is often not even removed until late in the afternoon. Most vacuum tube manufacturers advise against using brooms or water to get snow off the collectors. Hot, compressed air is the only safe way to remove snow and ice or defrost the tubes. Care should be taken when removing leaves and other debris that gets stuck or trapped between evacuated tubes and their mounting hardware.
Selective-coated flat-plate collectors are about as efficient as vacuum tube collectors in heating water to 140°F at low (less than 32°F) ambient temperatures. Evacuated tubes have an advantage over flat-plate collectors when you are heating water or HTF fluids over 180°F during late spring to early fall. Your choice of evacuated tubes or flat-plates should be based on the storage temperatures required and the seasonal solar index and microclimates at your site. Germany, which is at the same latitude as central Canada, has a mature solar thermal market for hot water and space heating. Flat-plate collectors make up 90% of the market versus 10% for evacuated tubes. The Germans use the right collector or best source for the job. The contractor should always pick the most appropriate collector, whether glazed or unglazed, flat-plate or a type of evacuated tube collectors, for the system’s design temperature. Evacuated tubes are made with annealed glass, which breaks easily in hail storms. The tempered glass used as the cover for flat-plate collectors is much harder to break in hail storms than annealed glass used by evacuated tubes. Tempered glass can take a direct hit by a 1-inch ice ball moving at 52 mph. On a flat-plate collector the entire evacuated tube must be replaced if the glass breaks (instead of just the glass cover).
Passive Solar Space Heating
The House as a Solar Collector
Every surface of a building that is directly exposed to the sun’s rays is collecting solar energy. Other surfaces, not directly exposed to the sun’s rays, can be heated by convection, conduction, and radiation.
The passive solar house maximizes this collection of solar energy.
- Siting considerations. During the heating season, the sun’s path makes an arc in the southern sky. When designing and constructing a passive solar house, the builder should be aware of the placement of trees, other houses, and mountains that might stand between the house and the sun’s path in the sky. These objects may create shadows on a building and reduce the solar collection for that section of the house.
- House orientation and shape. South sides of houses receive the most solar radiation during the winter. East and west sides receive more solar radiation in summer than in winter. When designing a passive solar house, make the south side of the house longer than the east/west side.
- Window placement. South-facing glass windows allow direct sunlight to heat the interior of the house. In an energy-efficient house, south-facing windows can provide up to 30% or more of the heating load. An overhanging eave or awning on south-facing windows will prevent overheating during the summertime. Also, too much glass on the west side of the house can easily overheat rooms that have already been warmed all day by the southern sun.
- Glass design. Maximize the R-value of windows without inhibiting visibility. New low-emissivity glass will decrease radiant heat loss and increase R-value without markedly lowering visibility. Improved glazings are in constant development and emerge on the market regularly.
- House color. Dark colors absorb more sun energy than light colors do. Light interiors reflect more light and reduce lighting needs.
- Solar greenhouse. When attached to a south wall, a solar greenhouse provides additional collector area as well as space for houseplants and food production in winter months.
Storing Passively Gained Solar Heat — Not an Alaska Strategy
The usual rule of thumb about passive solar design includes an indexed amount of what is termed “thermal mass” in the home. This typically is done by designing the solar gain space with a large amount of concrete masonry or other massive building material to store the solar heat during the day and release it (theoretically) back to the living space at night when the sun has set.
The rule of thumb for passive solar design that recommends one cubic foot of concrete for every square foot of solar aperture area was developed in the southern and southwestern U.S., where substantially more solar gain is to be had during the winter heating months than in Alaska. In 1983-1984, Richard Seifert conducted a study of the effects of thermal storage mass for the heating of a test building at the University of Alaska in Fairbanks. The study concluded that it is not really feasible to size a mass system such that it can function well for any significant portion of the year. For the major portion of the heating season (from mid-November to mid-February) the mass is of no practical use. Even during the best solar heating season of the year (March and April), the storage was useful on only 22 of 57 days (38%). The conclusion is that sizing a storage system to moderate overheating and store useful heat for later release is of very limited use at subarctic latitudes. And there is the additional factor of high cost for inclusion of thermal storage in a building, so it is difficult to recommend this strategy for Alaskans. For passive solar heating, construct south glazing with a thermally efficient building envelope. Keep the mass to a minimum in the house, and ventilate when overheating occurs.
The House as a Heat Trap
Passive solar heating goes hand in hand with good building, insulation, and conservation practices. If much heat is lost through walls, ceilings, and windows, the area required for solar energy collection must be relatively large and the amount of additional energy needed must be increased
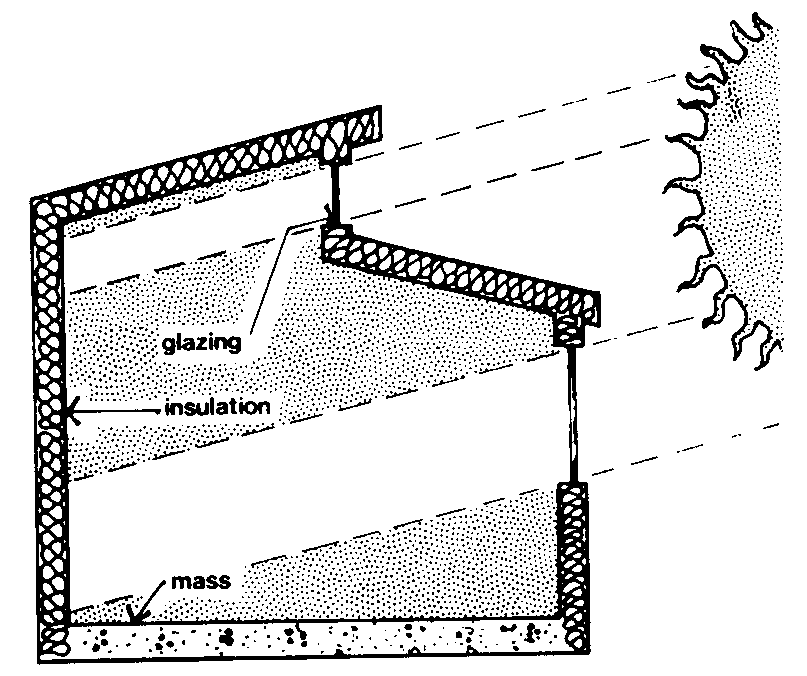
The recommended insulation values for a passive solar house in Alaska are R-38 walls and R-50-60 ceilings. However, any increased insulation will increase the solar performance.
R-38 walls and R-50-60 roofs along with proper sizing and placement of windows can cut fuel bills by 50% and more. Single-pane windows lose three times as much heat as triple pane windows and forty times as much as an R-38 wall. Insulated shutters should be used to reduce nighttime heat loss. There are also a number of new glazings on the market. These increase the insulating effect of glass and make the house more comfortable.
Heat Gain Through Glazing
The most widely used form of solar heating is sunlight entering a building directly through windows. This provides light (displacing artificial lighting) and eventually ends up as heat after striking objects in the room.
Heat Loss Through Glazing
To effectively reduce heat loss through windows, at least two layers of glass are needed in cold climates. A third layer of glass can reduce heat loss further. The best way to reduce heat loss through windows is to cover them with insulation during periods when there is no direct or indirect sunlight available. This movable insulation is also called a thermal shutter or night insulation.
The use of thermal shutters can often be forgone in the warmer climates of the Lower 48 because there is enough solar gain available during the day (usually) to offset the high heat loss from uninsulated glazing at night. However, to obtain the best performance on an annual basis in Alaska, thermal shutters are imperative. A small net gain in heating can be obtained from triple-glazed south-facing windows in many Alaska locations. But this gain is insignificant compared to the 25% to 40% heating load reduction that can be provided in some parts of the state by the creative use of south-facing glazing that is covered with R-9 shuttering during periods without solar gain.
Although many variations of mechanical and automatic shutters exist, none can truly serve all types applications in Alaska adequately. Several options for night insulation are discussed further in the passive design section.
Economics
Depending on the type of system used, the builder’s familiarity with the concept, and more important, the small details of passive solar design and construction, passive solar features can add 0 to 15% to design and construction costs. However, this is a one-time cost for energy-saving features that last the lifetime of the building. Many features such as proper siting, house color, house orientation and shape, and window placement can be considered without additional costs. Use of computer-aided design and new windows can minimize the extra cost of solar design.
Passive solar heating requires the occupant to become more aware of the surrounding environment. It provides heating provides space heat that is inherently simple, clean, safe, cheap, and lasts the lifetime of the building.
Federal Solar Tax Credits
Just like with solar photovoltaics, tax credits are available for solar thermal technologies as well. Rather than give a long description of which tax credits are applicable in which situations (which can change, readers should consult the excellent website www.dsireusa.org for more information on applicable tax credits.
Active Solar Water Heating
This final section was initially written by Rich Seifert for the 4th edition of “A Solar Design Manual for Alaska.” Readers should verify the information for themselves.
For much of Alaska, the heating of domestic or commercial hot water using solar energy is an economic option to consider. This is due to the following factors:
- The cost of energy is high in most areas.
- Although annual solar variability is high and solar energy provides a minimal amount of heating during the winter, hot water is needed year-round and solar energy can provide 40% to 60% of the hot water load on an annual basis in many locations. Unlike the heating load, the hot water load is not directly out of phase with the solar energy availability.
- Solar water heating is usually accomplished by using an active collector system, which can be easily retrofitted to most buildings.*
*Since this chapter was written heat pump technology has significantly improved and solar PV technology has become cheaper. Those thinking about solar thermal should investigate the economics of alternate combinations such as solar PV and heat pumps before making a final decision.
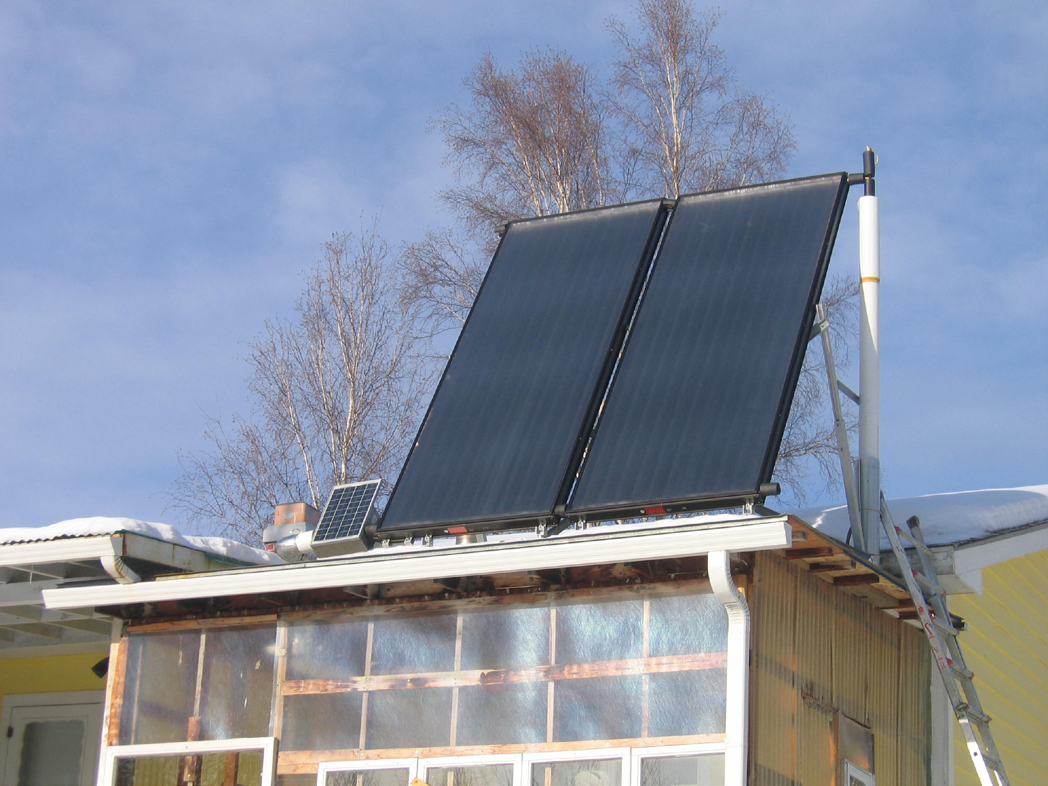
Solar Water Heating Discussion
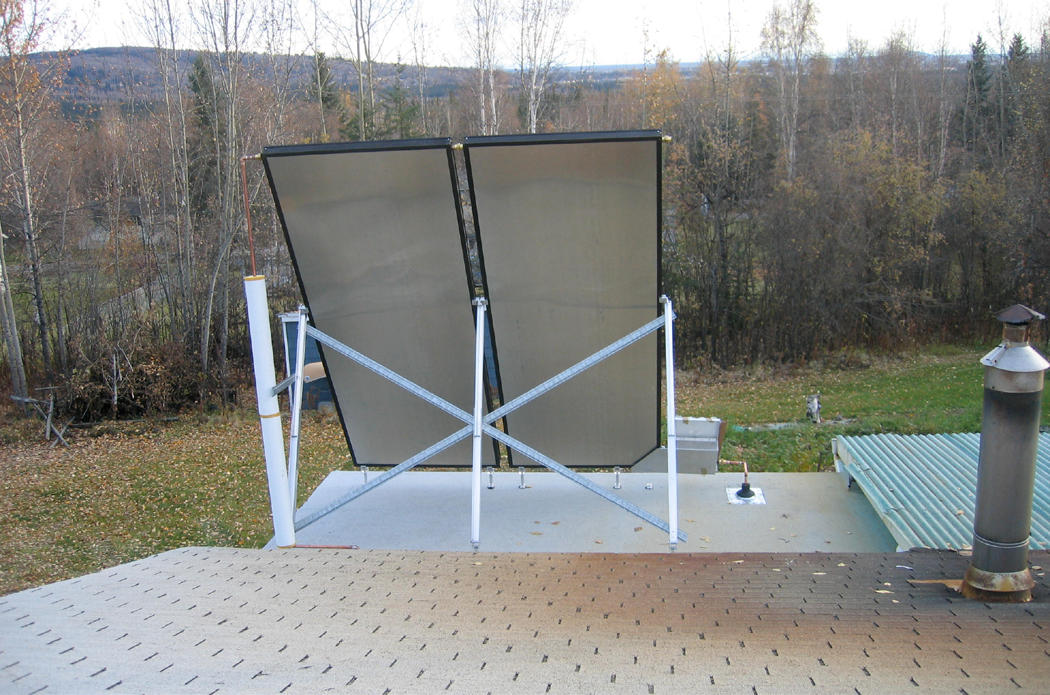
During the summer of 2006, I did an evaluation to determine why I wasn’t seeing the type of savings from the tripling of my wall insulation in my energy-efficient retrofit for my house. During that summer, I was able to measure the amount of fuel oil used, since I get automatic deliveries, from May 1 until September 14. During that period, I used 178 gallons of fuel oil. I assumed that almost all of that was owing to the consumption of hot water. So assuming that was a four-month rate of water use, just tripling it gave me an idea of how much of the fuel oil I use every year goes to heating hot water.
When I did the math on this, I discovered that a considerable percent of all my oil use might be for hot water! This led me to look into the prospect of getting a solar water heater.
I was able to purchase a Heliodyne solar hot water heating system through ABS Alaskan, a company that is a dealer for Heliodyne in Fairbanks.
With the help of many of my friends, including Kerry Gronewold and his son, Max, and a friend of theirs, and my plumbing consultant, Phil Schad, I was able to install an 80 sq. ft. solar hot water heater on my house to enable me to get a tax credit and lower my fuel use through. The photos show various stages of the construction and installation of the solar hot water heater.
In order to get the tax credit I was required to buy a solar hot water heater system that was certified by a performance test (done by the Florida Solar Energy Center, one of the national inspection and certification laboratories in the Lower 48). I spent over $8,000 plus labor and installation expenses to get this system installed.


These inside system views show a nearly complete installation. The initial temperature when fluid first flowed through the collector was 90° to 95° at outlet and 65° at the inlet on a clear day when the outdoor temperature was 0°F.
My original estimates for the performance of this system came from a computer solar simulation of a smaller system modeled using the computer program F-chart. The prediction was that I would get about 55% to 60% of my annual hot water heating needs from the solar system, which would save me, at the present rate of about $3.20 a gallon, something on the order of $800 a year. This along with the first year tax credit of $2,000 meant I would save nearly $3,000 the first year. If prices were to inflate, I’d save something on the order of $1,000 every year after that. So the payback would likely to be six to seven years.
Of course, if oil prices were to increase rapidly, the payback would occur even faster. Add to this the convenience of guilt-free showers, not contributing fossil fuel combustion to the global warming potential. A wonderful solar hot shower is good for morale in this time of increasing energy costs. It is especially comforting when you can do this in Alaska.
Why I Chose Flat Plate Collectors
I chose flat plate collector technology over some of the other newer systems, such as the evacuated tube-type collectors for the following reasons:
First, I was very familiar with flat-plate collectors and had built some of my own in the past, and I have a lot of confidence in them. They are simple, and I can fix them myself if they break or have leaks. Second, in discussion with Jake Tornatzky, the instructor for the solar course held in May of 2007, he mentioned that evacuated tube-type collectors are so efficiently insulated that snow will not melt off the tubes. So, unless you mount the evacuated tube collectors vertically on a south wall or without any tilt, it’s likely that snow cover would obscure them a great deal of time in the winter, especially in a climate like Fairbanks, where snow remains on the collectors for a long time.
Third, I have concerns about vandalism. A system of evacuated tubes, visible on a roof or on the side of a house, would be somewhat vulnerable to vandalism. Although this is a poor reason for concern, it is one of the reasons I chose to mount the collectors high, far off the ground and at a collector tilt of 60°. This optimizes collection at the equinox times of the year. (This is, however, NOT recommended!)
One more reason, although not nearly as important as the others, was that the flat-plate collector option gave me the opportunity to build a system that was independent of the local power supply. Having a photovoltaic pump means that if the power goes off in the middle of the day and the solar collectors are relying on grid power for the pump, they could overheat and boil off collector fluid. This isn’t all that unlikely. Putting together a system that is independent of the grid means that, in most cases at least, the photovoltaic pump would work regardless of whether the local power is on or not and the system would not stagnate. If a vacuum collector system did stagnate, it’s much more likely to overheat because the temperatures of operation are so much higher.
So, for all these reasons, I chose the lower-tech, slightly less efficient but more easily and independently operated flat plate collector system.
Subarctic Lessons in Solar Hot Water System Performance
My solar hot water system was installed in the Fairbanks area in the spring of 2008. Throughout the summer and since it has snowed, I have learned several things about the performance and installation of the system. These discoveries may be valuable to others who might consider such an investment.
Some important aspects of the solar water heating system were not obvious to me at the time I installed my system.
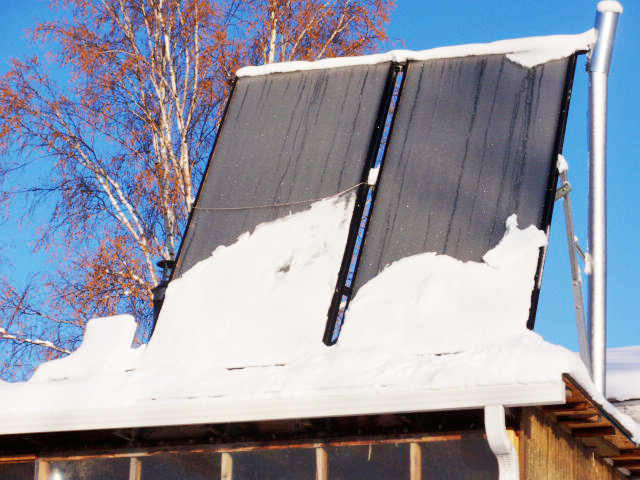
Figure 4 is a picture is of the system taken right after the first major snowfall. Not only does the system accumulate snow rather easily, but whatever snow is shed from the 60° tilt surface of the collectors accumulates at the bottom of the collector. The driving mechanism for the circulating pump for the solar system is a photovoltaic panel, visible on the lower left of the collector area. This is also easy to cover with snow! Even though I positioned the system on the roof of my greenhouse — because I thought that was the safest and best place to put it — the system is not maintenance-free. If I hadn’t climbed up and cleared this snow, the pump wouldn’t have come on.
As little as six inches of snow can pretty much put the system out of commission because of the shading of the pump photovoltaic power panel. This has two issues. When the pump is shaded, but the top of the collector may be free of snow (as it is in the above photo), the top of the collector will heat up and the pump will not come on because the snow is shading it. Two things could easily remedy this. The first is to raise the position of the pump to the top of the collector. Recent installations are now doing this. The second is to simply tilt the collector at a vertical (90°) tilt rather than at 60° tilt, keeping it sheltered from snow accumulation. The more experience I get with this system the more I realize that the installation of any solar thermal collector in a climate such as Interior Alaska or even Southcentral Alaska is much more maintenance-free if set at a 90° tilt, simply to keep the snow off of it. This is much more important than I first realized.
It may, in fact, be advantageous to mount the collectors vertically. The position of my collectors now, tilted at 60°, but 12 feet off the ground, is not optimal for receiving reflected solar radiation off the snow cover. Positioning the collector on a south-facing wall vertically or even on the roof vertically would enable it to get reflected solar radiation off the snow cover more readily and may even enhance the overall solar collection during the snow-cover seasons.
These are important considerations that I now recommend for Alaska. These recommendations are not as crucial in a climate like western Alaska (Bethel, Nome, and Kotzebue), where the consideration for solar hot water systems is becoming greater. These communities are much more prone to regular wind, and snow will tend to blow off the solar collectors at regular intervals. It is not a surprise to anyone who lives in the Fairbanks area that the wind-free nature of the climate allows snow to stay on a collector, often for a very long time. It can stay on a collector for months, impeding any operation of a flat-plate solar collector. It is important to pass these insights on to any prospective solar users. If I had it to do again, I would position my solar collectors vertically on a south wall and remotely install the PV pump panel higher on the system than it is presently located.
Computer Simulation
The development of sophisticated simulation computer programs has provided the architect and engineer with a convenient way to predict the performance of active and passive solar systems. It is now possible to evaluate various solar design options rapidly and at relatively small expense. This permits the designer to investigate new ideas and to best use existing systems.
Although modeling solar systems is inherently complicated, it is essential that the simulation programs be easily accessible and relatively simple to use. Now that many of the basic computational algorithms have been written and verified, increased attention is being given to making programs more user oriented. The F-chart computer simulation program by Beckman and Duffie was used to do the solar hot water economics charts in Appendix C.
F-chart has been a major evaluative tool in active solar water heating applications for many years, and it is constantly being improved and upgraded by one of its original authors, Dr. Bill Beckman. The tool uses standard (TMY3) weather data for hundreds of sites around the U.S. and Canada and for at least 20 locations in Alaska. This allows for a considerable range of evaluations to be made at a wide range of climatic locations around Alaska. It is used in this chapter to look at the actual performance of my own active solar water heater, shown in Table AC-1. There is also a module for evacuated tube collectors for water heating, a photovoltaic prediction module, and a passive solar home performance module. For my own system, the F-chart prediction for annual performance compares well with my own experience. As there is typically 9% variability in any solar year, that sort of variation is reasonable to expect from a solar system .
How Much Does a Solar Shower Cost?
What is the cost of solar hot water, or, for that matter, solar heat generally? I want to show clearly what I am seeing as costs for my own system in Fairbanks. It provides a realistic example of what to expect, and it may counter some of the misinformation out there. It should also lead to more realistic expectations for what solar heating can offer Alaskans. I will use Fairbanks data and my experience for my calculations.
Solar gain on my 80 square feet of flat-plate solar collectors averages about 80,000 Btu per day for 200 days of the year. This yields about 16 million Btu per year. This is the amount of energy I expect to get from my solar water system in Fairbanks. For comparison, 16 million Btu is about the equivalent of 160 gallons of fuel oil burned at 70% efficiency.
At a system cost of $8,000 (total), and an assumed life of 20 years, this is an annualized cost of $400 per year ($8,000 for 20 years = $400 per year).
This yields a cost of $25 per million Btu. This is equivalent to number 2 fuel oil at $2.67 per gallon (burned at 85% efficiency) without taking tax credits into account.
Living with My Domestic Hot Water System
First, my system is oversized, and in spite of gaining more energy in the spring and autumn “shoulder seasons,” it has overheated and dumped 180°F hot water from the PT safety valve — even with a 120-gallon storage tank. On a positive note, the system provides nearly 100% of my hot water needs for April through July, but I use less than 50 gallons of hot water per day.
Several things about this situation deserve mention. First, heat needs to be easy to dump from summer surplus, at least in Interior Alaska. Also, an additional expansion tank should be added to the hot water system near the solar storage tank. Finally, to avoid huge maintenance hassles, my best advice is to mount the collector(s) on a vertical (90°) wall and sheltered from snow (such as under an eave or deck).
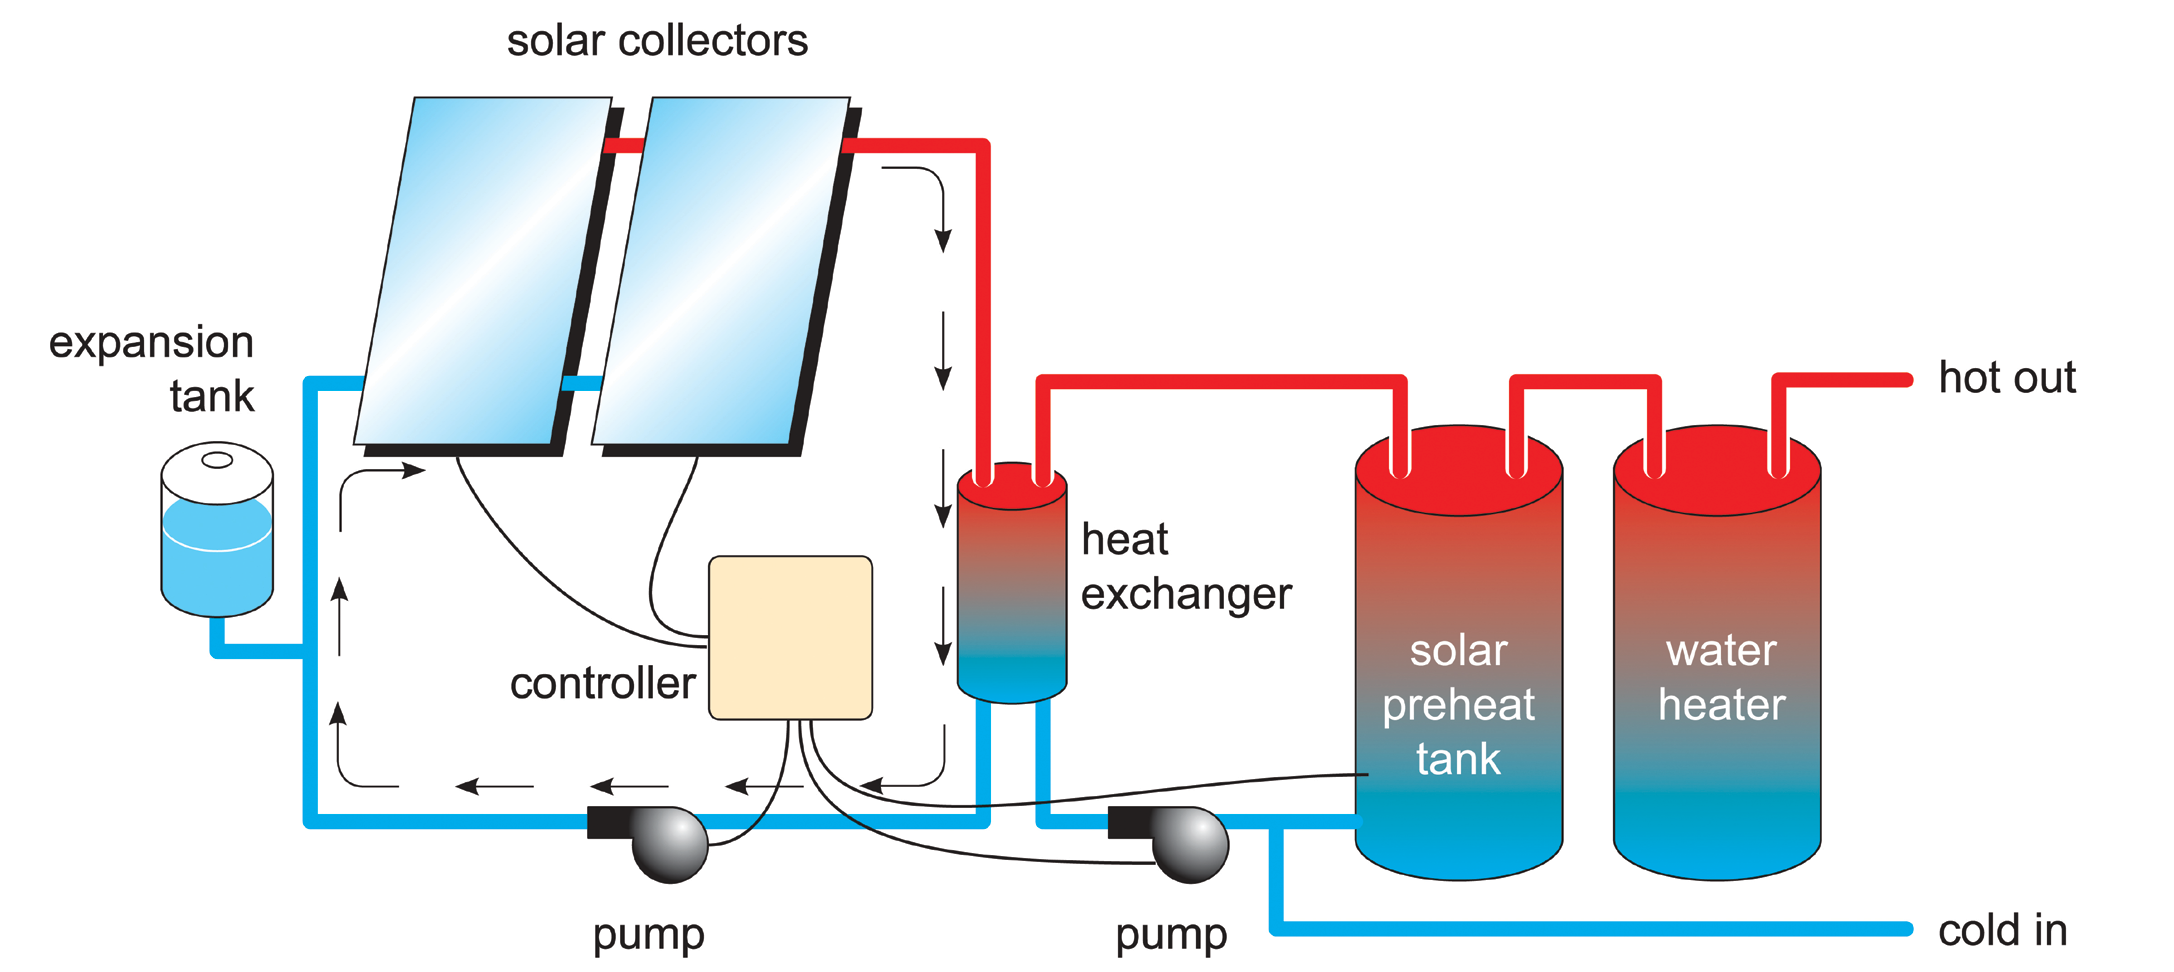
How the F-chart Solar Water Heating Simulations were Developed to Produce the Performance Tables
This manual adopts the following assumption for testing the feasibility of solar thermal in many locations around Alaska for which we have data:
Each location that is not rural Alaska is modeled using $3 per gallon fuel oil, if fuel oil is the primary fuel. If natural gas is the primary backup, the modeled price is about $10 per million Btu, or $.985 per Therm, which is 100 cubic feet. If the site is rural (Western and Northwest Alaska, Interior non-Railbelt, North Slope or Aleutians), a rate of $5 per gallon of oil is used. This is, of course, not precise for many locations, but is used to provide a standard of comparison to evaluate whether solar water heating is practical. The sites in Southeast Alaska are also modeled using a $3 per gallon backup fuel cost.
The runs are made with increased ground reflectance modeled at 0.8 (80% reflectance due to snow cover) during months when snow is typically on the ground.
The entire set of F-chart parameters can be found in Appendix D.
A Few More Technical Notes from Experience
Having lived with a solar water heating system for two years, I have some additional advice for obtaining the best performance and trouble-free hot water. First, a review of nearly all the F-chart runs for Alaska locations show that there is much more energy collected during the period from April through July than is needed for hot water. This energy can overheat the storage tank causing increased pressures and can even cause the pressure/ temperature relief valve to discharge hot water to relieve that pressure. Therefore, it is very wise to include some direct means to dump or otherwise use excess heat collected by the solar system. A few suggestions for how to do this are:
- Plumb in a unit heater for the basement or garage to heat those spaces when it is necessary to dump heat.
- Add a zone to an in-floor (panel) heating system to dump surplus heat into the main building or where most needed. This is only possible, of course, if you have an in-floor heating system option in your home.
- Dump heat outside, to a garden plot or other summer use option.
- Lower the over-all temperature in the solar water system by having a circulation pump to mix the water in the solar storage tank with that in the water heater.
Having the ability to utilize excess heat will actually improve the efficiency of heat production from your solar system, because the temperatures in the storage tank will be lower each morning and therefore able to gain more energy over the day.
A second option worthy of consideration is a small auxiliary tank capable of storing the volume of fluid in the collector system. Usually this is less than four gallons total. Since the collector system will always have an antifreeze solution in it — which is expensive to replace — it is good to have such a tank to enable easy checking for fluid acidity and optimum temperature protection without losing or polluting the antifreeze.
Knowing about these issues and building in the options they require will help you have a trouble-free system. With these considerations, the sun should provide you with a substantial portion of your hot water for the foreseeable future!
NOTES: The modeling shown above is for my own personal Heliodyne 80 ft2 solar domestic hot water system. It is oversized and consequently overheats in May and other periods of intense sun. The F-Chart tables shown in the appendix assume sixty-four (64) square feet of panels which is a more appropriate size for most Alaska household needs and usually supplies enough annual gain to meet 50% of the hot water needs. At rural sites assumed fuel costs are higher ($5 per gallon of fuel oil) than for other locations, (where $3.00 per gallon is used). If natural gas is available at a location, $.985/therm is assumed.
Assumptions
Water volume/collector: The ratio of the auxiliary water storage tank volume (or size) to collector area. Value used is 1.5, so for a 64 ft2 collector area, a storage tank on the order of 80 to 100 gallons is anticipated.
Fuel: This is the backup fuel, which is used to heat water when solar energy is inadequate. In most cases it is fuel oil, but in Anchorage and the Matanuska-Susitna area gas is modeled too.
Efficiency of fuel usage: This is typically 80%, the conservative value for combustion efficiency for both fuel oil and natural gas backup options.
Daily hot water usage: 40 gallons per day for all locations.
Water set temperature: 130°F for all locations.
Environmental temperature: The ambient temperature of the space where the hot water heater and/or storage tank is/are located. Always assumed 68°F, indoors.
UA of auxiliary storage tank: Heat loss rate from a modestly insulated, typical hot water storage tank (about equal to two inches of fiberglass).
Pipe heat loss: None assumed. Pipes are assumed to be insulated. Clearly this is an optimistic assumption, but the losses heat the space inside the building, which is mostly a positive.
Collector-store heat exchanger: Assumes typical flow rate and heat exchanger effectiveness. Used in all locations.
| Specifications | |
|---|---|
| Water volume/collector area | 1.50 gallons/ft2 |
| Fuel | Oil |
| Efficiency of fuel usage | 80.00% |
| Daily hot water usage | 40.0 gallons |
| Water set temperature | 130.0 °F |
| Environmental temperature | 68.0 °F |
| UA of auxiliary storage tank | 7.60 Btu/hr-°F |
| Pipe heat loss | No |
| Collector-store heat exchanger | Yes |
| Tank-side flowrate/area | 11.00 lb/hr-ft2 |
| Heat exchanger effectiveness | 0.60 |
| Flat-Plate Collector | |
|---|---|
| Number of collector panels | 2 |
| Collector panel area | 40.00 ft2 |
| FR*UL (Test slope) | 0.740 Btu/hr-ft2-F |
| FR*TAU*ALPHA (Test intercept) |
0.804 |
| Collector slope | 60 degrees |
| Collector azimuth (South=0) | 0 degrees |
| Incidence angle modifier calculation | Glazings |
| Number of glass covers | 1 |
| Collector flowrate/area | 11.000 lb/hr-ft2 |
| Collector fluid specific heat | 0.83 Btu/lb-F |
| Modify test values | Yes |
| Test collector flowrate/area | 11.000 lb/hr-ft2 |
| Test fluid specific heat | 0.85 Btu/lb-F |
| Economics Parameters | |
|---|---|
| Economic analysis detail | Detailed |
| Cost per unit area | $34/ft2 |
| Area independent cost | $1500 |
| Price of electricity | $0.16/kW-hr |
| Annual % increase in electricity | 10.0% |
| Price of natural gas | $0.00/100ft3 |
| Annual % increase in natural gas | 10.0% |
| Price of fuel oil | $3.00/gallon |
| Annual % increase in fuel oil | 10.0% |
| Price of other fuel | $20.00/106Btu |
| Annual % increase in other fuel | 10.0% |
| Period of economic analysis | 10 years |
| % Down payment | 100% |
| Annual mortgage interest rate | 4.0% |
| Term of mortgage | 20 years |
| Annual market discount rate | 4.0% |
| % Extra insur. and maint. in year | 10.0% |
| Annual % increase in insur. and maint. | 2.0% |
| Eff Fed.+State income tax rate | 15.0% |
| True % property tax rate | 1.8% |
| Annual % increase in property tax | 1.0% |
| % Resale value | 100.0% |
| % Credit rate in tier 1 | 30.0% |
| Maximum investment in tier 1 | $10,000 |
| % Credit rate in tier | 2 0.0% |
| Maximum investment in tier 2 | $10,000 |
| Commercial system? | No |
| Solar (10 6 Btu) | DHW (10 6 Btu) | Aux (106 Btu) | f solar fraction | |
|---|---|---|---|---|
| January |
1.259 | 1.384 | 1.045 | 0.245 |
| February | 1.893 | 1.270 | 0.587 | 0.538 |
| March | 3.786 | 1.409 | 0.095 | 0.932 |
| April | 4.605 | 1.347 | 0.000 | 1.000 |
| May | 4.238 | 1.358 | 0.000 | 1.000 |
| June | 3.904 | 1.278 | 0.000 | 1.000 |
| July | 3.802 | 1.275 | 0.000 | 1.000 |
| August | 3.564 | 1.252 | 0.002 | 0.998 |
| September |
2.537 | 1.209 | 0.294 | 0.757 |
| October | 2.151 | 1.267 | 0.519 | 0.590 |
| November | 1.287 | 1.259 | 0.952 | 0.244 |
| December | 0.580 | 1.337 | 1.337 | 0.000 |
| Year 33. | 605 | 15.645 | 4.830 | 0.691 |
Thermal output
- Solar column is the solar energy collected by the solar system each month, with an annual sum for the year (bottom row).
- DHW is the Btu required to raise the water temperature to 130°F for a 40-gallon-per-day hot water demand as used in all subsequent runs.
- Aux is the amount of backup heating required, in this case from an oil-fired boiler.
- f column is the fractional percentage of energy provided each month by the solar collectors, and the annual fraction is the final total fraction for the year.
References
Alaska Building Science News (AKA The ABSN newsletter) Excerpts from issues Fall 2007 through Winter 2008, Vol. 13, issues 1 and 3, and Vol. 14 issues 1 and 2. Newsletter archived at: 1995 to 2012 archives
Alaska Housing Finance Corporation (AHFC) 2002. Alaska Building Energy Efficiency Standards. AHFC, 4300 Boniface Parkway, Anchorage, Alaska 99504. 44 pp. including appendices. Also available at: Alaska Housing Building Energy Efficiency Standard (BEES)
Alaska Oil and Gas report. 2007. Alaska Dept. Of Natural Resources Division of Oil and Gas. 66 pp.
Anderson, B. with Michael Riordan. 1976. The Solar Home Book. Cheshire Books, Harrisville, NH297 pp.
ASHRAE Handbook of Fundamentals. 1977. American Society of Heating Refrigeration and Air Conditioning Engineers, New York. 544 pp. Aspnes, J.D., and J.P. Zarling. 1979. Solar Heat Gain Through Windows at High Latitudes. Pages 208 to 211 in Proceedings of Solar 79 Northwest Solar Energy Conference. Seattle, WA.
Balcomb, J.D., Dennis Barley, Robert McFarland, Joseph Perry, Jr., William Wray, and Scott Noll. 1980. Passive Solar Design Handbook, Vol. 2. Office of Solar Applications, U.S. Department of Energy. DOE/CS-0127/2, Dist. Ct. UC-59. 269 pp.
Beckman, W.A., S.A. Klein, and J. Duffie. 1977. Solar Heating by the F-Chart Method. J. Wiley & Sons, NY. 200 pp.
Campbell, Colin J. and Jean H. Lefferrere. 1996. The End of Cheap Oil. Scientific American. March, 10 pp.
Cinquemani, V., J.R. Owenby, and R.G. Baldwin. 1978. Input Data for Solar Systems. U.S. Department of Energy. Under interagency agreement No. 1E (49-26) -1041. Asheville, NC. 192 pp. Climatic Atlas of the United States. 1968. Environmental Sciences Services Administration, U.S. Department of Commerce, Washington, D.C. Item 208-B-1, Stock No. 003-014-00013-4. 82 pp.
Duffie, J.A., and W.A. Beckman. 1974. Solar Energy Thermal Processes. J. Wiley & Sons, NY. 386 pp. Dumont, Robert S. 2005. Experiences from Low Energy Houses in Canada, Proceedings of Low Energy Housing Symposium, Sisimiut, Greenland, April 15-18, 10 pp.
F-CHART version 2008. c. by Bill Beckman.
Ferber, R.R., and R.G. Forney. 1979. The DOE Photovoltaics Program—An Overview. Paper presented at the second Miami Conference on Alternative Energy Sources. University of Miami, Coral Gables, FL.
Gilpin, R.R. 1977. The Use of South Facing Windows in a Northern Climate. National Solar Energy Society of Canada, Edmonton, Alberta. Solar Energy Update, 1977. 12 pp.
Grant, E.L., W.G. Ireson, and R.S. Leavenworth. 1976. Principles of Engineering Economy. Ronald Press Company, New York. 624 pp.
Gubareff, G.G. et al. 1960. Thermal Radiation Properties Survey, second edition. Honeywell Research Center, Minneapolis-Honeywell Regulator Company. Minneapolis.
Hartman, C.W. and P.R. Johnson. 1978. Environmental Atlas of Alaska. University of Alaska, Institute of Water Resources, Fairbanks, AK.
Hunn, B.D., and D.O. Coldfell, II. 1977. Determination of Average Ground Reflectivity for Solar Collectors. Solar Energy. 19(1):87-89.
Konrad, A., and B.T. Larsen. 1978. ENCORE-CANADA: Computer Program for the Study of Energy Consumption of Residential Buildings in Canada. Pages 439 to 450 in Proceedings, Third International Symposium on the Use of Computers for Environmental Engineering Related to Buildings. Banff, B.C., Canada.
Korsgaard, V. 1977. Zero Energy Houses, Report NP-22388, N.T.I.S. Springfield, Virginia.
Kusuda, T., and K. Ishii. 1977. Hourly Solar Radiation Data for Vertical and Horizontal Surfaces on Average Days in the U.S. and Canada. National Bureau of Standards, U.S. Department of Commerce, Washington, D.C. NBS Building Science Series Number 96. 405 pp.
Lane, Tom. 2004. Solar Hot Water Systems-Lessons Learned 1977 to Today. Published by Energy Conservation Services of North Florida, 6120 SW 13th Street, Gainesville Florida, 32608. Google Books
Liu, B.Y.H., and R.C. Jordan. 1960. The Interrelationship and Characteristic Distribution of Direct, Diffuse, and Total Solar Radiation. Solar Energy. 4(3):1–19.
Liu, B.Y.H., and R.C. Jordan. 1961. Daily Insolation on Surfaces Tilted Toward the Equator. ASHRAE Journal. 3(10):53–59. Liu, B.Y.H., and R.C. Jordan. 1963. A Rational Procedure for Predicting the Long-Term Average Performance of Flat-Plate Solar Energy Collectors. Solar Energy. 7(2):53–74.
Liu, B.Y.H., and R.C. Jordan. 1977. Availability of Solar Energy for Flat-Plate Solar Heat Collectors. Pages v-1 to v-26 in R.C. Jordan and B.Y.H. Liu, eds. Applications of Solar Energy for Heating and Cooling of Buildings. American Society of Heating, Refrigerating and Air-Conditioning Engineers, New York.
Net Zero in Canada. Sept. 2008. Article in Energy Design Update, pp 1-–6.
Noll, E.M. 1975. Wind/Solar Energy. Howard W. Sams and Company, Inc. 4300 West 62nd St., Indianapolis, IN 46268. 208 pp.
Quinlan, F.T. 1978. SOLMET - Hourly Solar Radiation Surface Meteorological Observations. vol. 1. U.S. Department of Energy, Asheville, NC. Publication TD-9724. 52 pp.
Russell, Scott, 2006. Solar Electric Systems Simplified, in Home Power magazine. Used in full, with permission.
Seifert, R.D., Jack W. Schmid, and Dr. R. A. Johnson. June 17-19 June, 2002. Controlling Indoor Air Quality in Subarctic Houses. Presented at the 6th Nordic Conference on Building Physics, NTNU, Trondheim, Norway. 8 pp.
Seifert, R.D. and George S. Mueller. June 1983. An Analytical Study of Passive Solar Energy and Mass Storage: Observations from a Test Building in Fairbanks, Alaska. Report No. AK-RD-85-21. 50 pp. plus appendices.
Shah, Louise Jivan. 2005. Evacuated Tubular Collectors, paper given at the Low Energy Housing Symposium, Sisimiut, Greenland, April 15–18, 15 pp.
Solar Energy Industries Association, www.seia.com. Federal Tax Credit press release.
State of Alaska, 2009. Statistical Report of the Power Cost Equalization Program, FY2008.
Wise, J.L. 1979. Alaska Solar Radiation Analysis. Arctic Environmental Information and Data Center, University of Alaska, Anchorage. 27 pp.
Zarling, J.P. 1981. Air-to-Air Heat Recovery Devices for Small Buildings. Alaska Department of Transportation and Public Facilities, Fairbanks. Interim Report. 19 pp.
Zarling, J.P., and R.D. Seifert. 1980. Passive Solar Design at Subarctic Latitudes. Paper presented at the National Conference of the Solar Energy Society of Canada, Vancouver, B.C. 6 pp.
Zarling, J.P. June 1980. Passive Solar Heating in Alaska. Report No. AK-RD-81-15, Alaska DOT&PF. 17 pp.
Appendix A: Passive Solar Heating An Energy Factsheet
Solar energy is often discounted as a viable energy alternative in northern latitudes such as Alaska. In reality, the energy of the sun can provide a significant portion of Alaska’s heating needs. The most efficient and least expensive way to tap this resource is through design and construction of houses that collect and store solar energy without fans, pumps or other mechanical devices. Passive solar heating makes use of warmth moved by the natural processes of reflection, radiation, conduction and convection.
The Solar Energy Resource
Passive solar heating, especially when used in conjunction with conservation, can significantly reduce Alaska's dependence on costly fuels. For example, two identical houses sitting side by side and facing south will receive the same amount of solar energy. However, if one is more heavily insulated than the other and has fewer cracks where air can leak in and out, it will retain more heat and require less fuel over the heating season. In fact, insulation may prove to be the most important element of passive solar design.
Insolation (incoming solar radiation) is usually measured in terms of the number of Btus striking a square foot of surface during a specified time period. The amount of insolation received at a given point in the day is dependent upon the area and thickness of cloud cover as well as the sun angle and the number of hours of available sunlight. Because of the interplay of these factors, insolation statistics do not necessarily correspond with latitude; e.g., Juneau doesn’t receive more solar radiation than Fairbanks. In Alaska, those regions with continental (Interior) and transitional (Southcentral, Southwest and Northwest) climates are the areas where solar heating would most likely be practical. In March, the average insolation on a vertical south-facing surface in Btu/ft2/day is 1,687 for Matanuska, 1,892 in Bethel and 1,808 in Fairbanks. A vertical surface receives its maximum insolation in March and April; a horizontal surface receives its maximum insolation in May and June.
For efficient passive solar heating, a house must serve as a (1) solar collector, (2) heat storehouse and (3) heat trap.
The House as a Solar Collector
Every surface of a building that is directly exposed to the sun’s rays is collecting
solar energy. Other surfaces not directly exposed to the sun’s rays can be heated
by convection, conduction and radiation. The passive solar house maximizes this collection
by:
- Siting considerations. During the heating season, the sun’s path makes an arc in the southern sky. When designing and constructing a passive solar house, the consumer should be aware of the placement of trees, other houses and mountains which might stand between the house and the sun’s path in the sky. These objects may create shadows on a building and reduce the solar collection for that section of the house.
- House orientation and shape. South sides of houses receive the most solar radiation during the winter. East and west sides receive more solar radiation in summer than in winter. When designing a passive solar house, make the south side of the house longer than the east/west side. But don’t build a long, one-story California ranch-style house, because you will have too much surface area of roof and walls where heat is lost.
- Window placement. South-facing glass windows allow direct sunlight to heat the house interior. In an energy-efficient house, south-facing windows can provide up to 30 percent or more of the heating load. An overhanging eave or awning on south-facing windows will prevent overheating during the summertime. Also, too much glass on the west side of the house, where the low evening sun hangs for hours, can easily overheat rooms that have already been warmed all day by the southern sun.
- Glass design. Maximize the R-value of windows without inhibiting visibility. New low-emissivity glass will decrease radiant heat loss and increase R-value without markedly lowering visibility. • House color. Dark colors absorb more sun energy that light colors do. Light interiors reflect more light and reduce lighting needs.
- Solar greenhouse. When attached to a south wall, a solar greenhouse provides additional collector area as well as space for houseplants and food production in winter months.
Storing Passively Gained Solar Heat — Not a Strategy for Alaska
The usual rule of thumb about passive solar design routinely includes an indexed amount of what is termed “thermal mass” in the home. This typically is accommodated by designing the solar gain space with a large amount of concrete masonry or other massive building material to store the solar heat during the day and release it (theoretically) back to the living space at night when the sun has set. But is this an economical strategy for Alaska? The answer is generally no! Why is this?
The rule of thumb for passive solar design that recommends one cubic foot of concrete for every square foot of solar aperture area was developed in the southern and southwestern U.S., where substantially more solar gain is to be had during the winter heating months than in Alaska. This thermal mass question needed to be tested with research, so in 1983 to 1984, Richard Seifert conducted a study of the effects of thermal storage mass for the heating of a test building at the University of Alaska Fairbanks. The conclusions from this testing indicate that it is not really feasible to size a mass system such that it can function well for any significant portion of the year. What happens is that for the major portion of the heating season (from mid-November to mid-February) the mass is of no practical use. Even during the best solar heating season of the year (March and April), the storage was useful on only 22 of 57 days (38 percent). The fundamental conclusion is that sizing a storage system to moderate overheating and store useful heat for later release is very limited at subarctic latitudes. There is also the additional factor of high cost for the inclusion of thermal storage in a building, so it is difficult to recommend this strategy for Alaskans. For the most effective utilization of passive solar heating, we suggest south glazing combined with a thermally efficient building envelope. Keep the mass to a minimum in the house, and ventilate when overheating occurs. This means solar gain is an economical source of opportunity, but not worth it to the average homeowner (at this time) to provide for its short-term storage.
The House as a Heat Trap
Passive solar heating goes hand in hand with good building, insulation and conservation practices. High heat loss through walls, ceilings and windows increases both the area required for solar energy collection and the amount of additional energy source needed.
The recommended minimum insulation values for a passive solar house in Alaska are R-30 walls and R-50 ceilings. However, any increased insulation will increase the solar performance.
Well-insulated walls and roofs, along with proper sizing and placement of windows, can cut fuel bills by 50 percent and up. Single-pane windows lose three times as much heat as triple-pane windows and 40 times as much as an R-40 wall. Insulated shutters should be used to reduce nighttime heat loss. There are also a number of new glazings on the market, such as low-emissivity, “heat mirror”®. These increase the insulating effect of glass and make the house more comfortable.
Economics
Depending on the type of system used, the builder’s familiarity with the concept and, more importantly, the small details of passive solar design and construction, passive solar features can add up to 15 percent to design and construction costs. However, this is a one-time cost for energy-saving features that last the lifetime of the building. Many features such as proper siting, house color, house orientation and shape, and window placement can be considered without additional costs. Use of computer-aided design and new windows can minimize the extra cost of solar design.
Passive solar heating requires the occupant to become more aware of the surrounding environment.
Passive solar heating is gaining market acceptability. In Alaska, passive solar houses have been built in Anchorage, Homer, Juneau, Delta Junction, Copper Center, Ambler, Fairbanks and other locations. Passive solar heating provides space heat, which is inherently simple, clean, safe, cheap and lasts the lifetime of the building.
Sources
Seifert, R.D., and G.S. Mueller. 1983. An Analytical Study of Passive Solar Energy and Mass Storage: Observations from A Test Building in Fairbanks, Alaska. Research Report to Alaska Department of Transportation Public Facilities Research Section, 2301 Peger Road, Fairbanks, Alaska. 42 pp. plus appendices.
Mazria, Edward. 1979. The Passive Solar Energy Book, Rodale Press.
Kreider, J., and F. Kreith. 1977. Solar Heating and Cooling, McGraw Hill.
Other Publications
Balcomb, J.D., et. al. 1980. Passive Solar Design Handbook, Volume 2: Passive Solar Design Analysis. Prepared for U.S. Department of Energy, Office of Solar Applications, Passive and Hybrid Solar Buildings Program, Washington, D.C. 20585.
Other Resources
AHFC Resource Center
4300 Boniface Parkway, Suite 190
Anchorage, Alaska 99504
Phone: 907-388-6100 or 800 478-4636
Fax: 907-338-1747
Web site: AHFC resources
Mailing address:
P.O. Box 101020
Anchorage, AK 99510-1020
Online Resources
The following web sites are very deep sources of information about solar design:
International Solar Energy Society
Appendix B: Solar Greenhouses
This section was written by Art Nash, energy specialist with the UAF Cooperative Extension Service. The material is from his greenhouse heat workshops.
Extending the growing season with solar energy
Solar heating is not only an alternative to fossil fuels for home space heating and residential electrical production, it can also be used for growing food. One of the best uses of solar for increased horticulture yields or agricultural production is extending the growing season. Sunlight from solar exposure (or similar substitute from spectrum lighting) is a needed ingredient in itself for plant growth. In Alaska climates, heat is also needed to get plants started, to foster stem and leaf growth and to mature the fruit of the plant to harvestable size.
Before purchasing and setting up any solar collecting equipment remember that there are certain crop varieties of potatoes, carrots, turnips, radishes, beets, peas, and leafy vegetables that can grow without added heat in unsheltered dirt during Alaska’s short growing season. Yet many other popular crops, including broccoli, cabbage, cauliflower, green beans, squashes and leafy vegetables such as kale, should be started in the heated indoors to get them off to a good start before being transplanted straight into the ground outdoors. And then there are those plants such as tomato and cucumbers that grow best indoors (heated) for the full length of their growing season.
Keep in mind your plant varieties when planning how to use solar heating as some plants can tolerate high and low diurnal and nocturnal swings in temperatures better than others. Plan how you will store and distribute your solar energy for use at night or on overcast days while keeping in mind the types of food you plan to grow. In Interior Alaska, 42°F is the temperature most seeds need to begin germinating. Often soils don’t reach that temperature until June, and then they only maintain it through August. However, adequate solar gain begins in March, so capturing, storing and accessing that heat could allow seeds to germinate earlier in the spring.
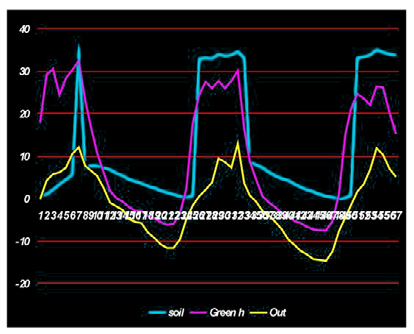
Day and night swings in temperature inside (pink line) and outside (yellow line) of a Yukon greenhouse. The blue line shows the first inch of soil temperatures.
While other fuels can be used to heat your greenhouse, passive, hydronic and PV solar energy offer heat without the emissions from combustion. Though commercial greenhouse boilers often use propane, wood, and even diesel to operate, they need to be vented outside the greenhouse structure; if they are not done so properly, the incomplete combustion can create carbon monoxide and ethylene gas, which can cause abnormal plant growth.
Of course, solar radiation, heat gain, and heat storage are not the only factors to consider when looking to extend the beginning of the greenhouse season. It is also important to consider plant protection, air movement, and moisture ( from transpiration of the plants inside as well as precipitation from the outside) control when choosing greenhouse options.
Heat collection and storage
Photovoltaic solar often requires battery storage, which may not suite the scale of a residential greenhouse. However, if it is used in a greenhouse in an area with no utilities available, a number of systems can run off the electrical generation. Air fans for heat movement and ventilation can operate from small, flexible PV pads for night operation. In the case of larger plots outside the greenhouse structure, irrigation pumps and sprinklers can utilize the electricity generated. In situations where flat-plate or evacuated-tube solar panels are used, the PV production can run either 12-volt or, in some cases, 110-volt circulating pumps to move warmed fluids through to heat exchangers.
Heat for plants is more efficiently collected and distributed with hydronics than it is with air or gasses, and the location of the heat application makes a difference for plant yields. Early in the germination stages, heat is best applied to the roots of the plant. Fluids can do the best job of carrying heat to the roots, which absorb it through the moistened soils. Warmed fluids can be dripped into the soils from above or routed through open-ended tubing below the roots. Black 55-gallon holding barrels can be used to passively heat the water, which can be applied by gravity through tubing into the soil. In a setup like this, it is important to monitor the temperature of the water and have a mixing system with a cold-water reservoir. As a rule of thumb, when thinking of energy storage, know that one pound of water can store a Btu of heat for every degree (F) that the temperature rises.
While heat can be applied to roots from underneath radiant electric heating pads powered by PV panels and batteries, it can also be transmitted through tubes of liquid that push the heat along through the soil via small electric heat pumps. As the growing season progresses, heat applied above the soil can spur growth to stems and leaves. As the solar gain hours decrease in August and September, the fruit of the plant is ripening and can utilize heat applications best in the air around the product to be harvested; this is especially true once temperatures dip and the first hard frost comes.
Because of the cost of equipment that is needed in procuring, storing and distributing solar heat, and effort/labor, it is always good to ask the following question from “Alaska’s Sustainable Gardening Handbook,” Chapter 9 before setting up a solar apparatus: Is the crop valuable enough (to you or at the market) to warrant the additional expense, or can the crop be grown successfully without additional help?
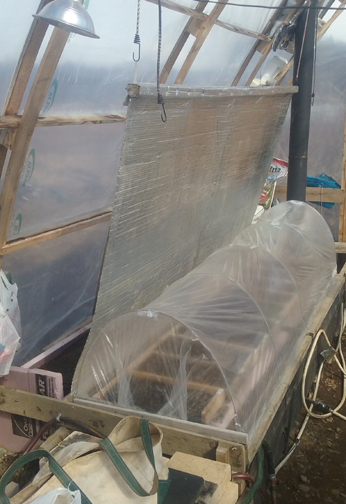
A greenhouse itself is a kind of passive, stationary solar collector. Yet the additional heating of space in a traditional greenhouse is a fairly inefficient way to utilize solar energy. The structures that are used to start plants or house them during the growing season generally have little heat retention properties when compared to residential buildings. For instance, the insulation value in a vertical wall in a new home in Anchorage, Alaska, generally has an R-value of 19-27R, (ceilings are often around 36R). Because of the “glazing,” or wall structure material, a double-walled, clear polycarbonite or acrylic greenhouse panel will be around 3.5R. Walls composed of 6-milimeter clear plastic are only 1R. Some growers in the maritime climates of Alaska will double layer the clear plastic sheeting; while this reduces light transmission somewhat, when a low-wattage fan is added to billow the two pieces of sheeting, the R-value is increased 50 percent. Keep in mind that there are other factors to consider aside from the heat retention value when choosing glazing, such as the quality of light transmission, durability in the sun and potential maintenance requirements.
Distribution of the heat at a regulated rate and temperature level is important, but so is the height of the growing medium and the area of the plant where the heat is applied. This can vary from ground level to a few feet high. The advantage of adding thermal curtains is that they are light and quite flexible. Also, they adjust and direct incoming radiation straight to the plants during the day, but they can be used as an insulated wrap over inverted U-shaped wiring to protect against nighttime cooling.
Structure types implementing solar
Cold frames (also called hotbeds) can be inexpensively made from large shower doors or small, framed windows for cool-weather crops in the shoulder seasons (early spring before break-up and later fall after the first hard frost). Passive solar heat is simply collected when the sunshine comes through a clear glazing. A cold frame is essentially an intermediary environment that can hold plants until they are ready to be transplanted into the unprotected garden. Use black containers filled with water or dark, clothlike materials over the dirt to collect solar energy and store it for heating the cold frame in the dark of night. For more information on cold frames, go to Yukon Green House.
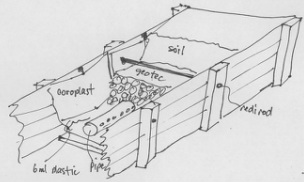
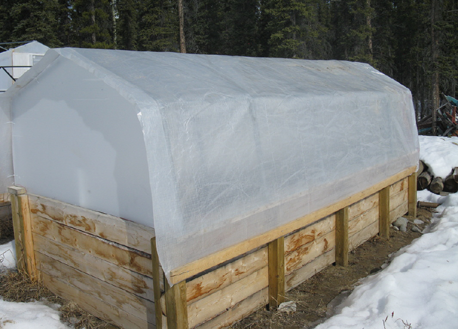
High tunnels and hoop houses allow crops to be planted directly in the ground in the exposed dirt floor. Be aware that because of the height of a high tunnel there can be a vertical stratification of the solar heat, though the curved surface of the clear plastic sheeting all the way up to the apex of the top allows for simultaneous heat escapement throughout.
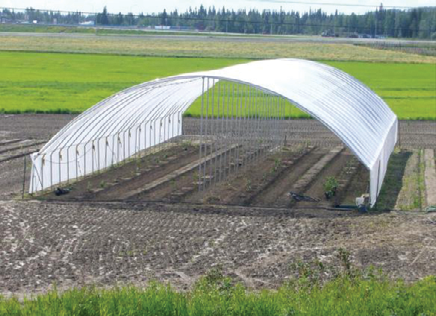
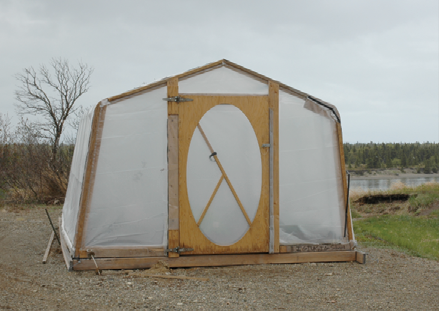
A three-season greenhouses has a rigid, wooden back that faces the north and is insulated with 19R (or more rock wool insulation. The south-facing front glazing takes in solar radiation, which is stored in two heat storage frames — one along the front wall and one along the back wall — full of river rock. The actual soil and plants are set in a compartment on top of these storage frames. The south-facing side has a slanted roof of curved polycarbonate panels. A small PV pad is used to power a ventilation fan three inches in diameter for air movement. For information and data on these units go to Yukon Green House.
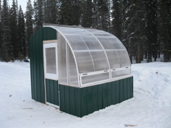
Attached greenhouses share a wall with the main residence, making access readily available. There is also an insulated wall in the back of the greenhouse. Often it is close to running water and electricity. Compared to a freestanding greenhouse, the site location may not be the sunniest space in the yard or in the best area to pick up solar radiation reflected from the yard or surrounding grounds. (In addition, moisture, summer heat, dirt, insects, and chemical odors may enter the home).
A-frames have glazing angled down to the ground, which gives them full exposure to the sun, providing there is no snow buildup. As with to high tunnels, there can be a second layer of clear plastic film attached to the inside for better insulation during cooler weather. It is limited in width and size when it comes to tending plants inside. Also, ventilation from the sides is required so plants don’t overheat. There are other shape variations of structures that can be used that have different elements of interplay between glazings for concentrated radiation, ventilation/heat movement, passive snow clearing, and wind sheer strength. In the Far North, people often use shutters, sliding insulated panels that can be placed over the glazing at night to increase heat retention, and curtains that roll up to allow ventilation.
Such shutters and roll up curtains can be attached to electric timers or sensors or operated by hand. There are also mechanical pieces of equipment such as paraffin wax cylinders and hinged vents to control temperature and moisture which do not require electricity.
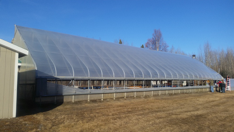
In conclusion, with food security a concern for Alaska, garnering as much “free” heat from the sun (though the technology for transmitting and distributing it bears costs) is a prudent measure. Extending the growing season by getting heat in early spring as well as into the fall is particularly important. It might be helpful to consider the 95-85-3 rule: Ninety-five percent of the state’s consumed food comes from outside Alaska, and 85 percent of that is on three barges a week from Seattle to Anchorage. The possibility of disruptions of such food shipments are increasingly dangerous and one of the reasons that many Alaskans are trying to grow their own food. A longer growing season for more yield only makes sense — especially considering the solar gain in the state during the growing season.
Appendix C: Do-It-Yourself Solar
This section was written by homeowners Sam Dennis in the MEA service area and Jenn Miller in the ML&P service area. It describes the process that they went through to install solar PV on their houses.
Chugiak, Alaska
Sam Dennis
This section is based on my experience designing and installing an 8 kW solar array in Chugiak, Alaska. Our property location has substantial shading issues and the only viable solar location was on the garage roof, which has only a 10° slope, so that made the solar potential that much more limited. Because of these challenges, it was clear that the only way the project would work out would be if I could install it myself at a substantial discount over a commercial install. What I’ve tried to capture below are the key findings for the Alaska DIY person; the basics of solar system install are available online.
Do-it-yourself (DIY) solar means you, the homeowner, do most or all the work. This will entail a lot of learning and some sweat equity; the benefits are a significant cost savings, knowing the system inside and out, and the sense of satisfaction that comes with doing a project yourself. This section is not meant as a comprehensive DIY installation guide, but rather a high-level outline of the sequence of steps in a DIY project, with a focus on Alaska challenges. There are many detailed guidance resources available online that provide detailed instructions. Some of the best ones we’ve found are listed at the end of this section. While you can figure all this out on your own, finding someone to coach you through the process makes it much easier and less stressful.
Your residential solar PV project can be broken down into three stages: site assessment, design/procurement, and installation.
Site assessment
Site assessment is the initial assessment of your location to identify the site suitability
for solar and identify any issues that would preclude a solar install. Questions to
consider in this stage are:
- What are you trying to accomplish by installing solar; is solar the right answer? If your goal is simply to save money on your energy bills, investing in basic energy efficiency upgrades will almost certainly give you a better return on your investment than a solar installation. Only if you have already made all the obvious efficiency upgrades and/or you want a solar array for the fun of it should you pursue solar.
- Do you have a suitable location on your roof or ground? A good location (roof or ground) faces generally south and does not have too much shade from trees, mountains, or adjacent structures during the spring, summer, and fall. There are a variety of site assessment tools that can be used to measure shading. A simple place to start is to print out a sun path diagram for your location. Then load a compass and level apps on your phone and go outside. With the diagram, compass, and level apps you can get a rough idea of the times and dates your location is going to be shaded. An easy location to create a sun path diagram is here: University of Oregon Sun path chart program
- Are there neighborhood or utility restrictions on solar? Some homeowners’ associations may prohibit solar panels on your roof. Check before you go too far.
- What size system should you install? You may be limited by space, in which case you will install as much solar as you can fit. If not, look at your electrical bill and see how much electricity you have been using. If you’re shaky on the difference between kilowatts and kilowatt-hours then start here: BizEE Energy Lens. Once you know how much energy you use each month, you can start figuring out how much solar you want to install. The best tool for this is PVWatts from the National Renewable Energy Laboratory, PVWatts calculator. Enter your zip code, select a nearby weather station, and click the right arrow. On the next page enter a guess for system size. Try 5 kilowatts. The only other variable you need to start out is the angle of your solar panels. If you are mounting on a roof, then use that angle (the angle you enter is from horizontal). Then click the right arrow and PVWatts gives an approximation of what you can expect for kilowatt hours by month. Compare this against your electric bill and start adjusting. If you are in this to maximize the economic benefit, then size your system to just cover your electricity usage in May/June. If you are OK with a lower rate of return, then you can oversize the system. The low cost of DIY systems means that even if you only get paid avoided cost (wholesale) for the excess power you generate in the summer months it still is economic but will have a longer payback than if you size the system for your May/June loads.
- Is there space (or can you make space) for additional 240 V breakers in your distribution panel? You will tie your solar system into your existing circuit breaker panel so you’ll need space for at least one 240 volt circuit breaker. If you don’t have any spare space, you may be able to create space by installing tandem (half-width) circuit breakers to free up space. If you are not familiar with this, or modifications are required, it is highly recommended that you hire an electrician. Solar input has to go into the end of your panel opposite where the grid connection is.
Once you have the answers to these questions, you need to decide if you want to proceed. An approximate cost to use for determining if you want to proceed is $2/W (before tax credit). Once you have determined that a solar installation is feasible at your site and you want to proceed, you can move into the design/procurement stage. It is best to combine these stages because the market in solar equipment is evolving so rapidly that in order to get the lowest cost it is necessary to build the design around cost/availability of equipment. The alternative is to specify manufacturer/type up front and procure regardless of price.
Design and procurement
- Are there permit requirements from local or state government? Requirements vary widely so check your government website. In Anchorage, building permits are required inside the original city limits but not in what was originally the Anchorage borough.
- What are the utility requirements for net metering interconnections? The railbelt utilities are all currently required to offer net metering connections, and all have information on their websites about their requirements for interconnecting a net-metered solar system. It is highly recommended that you file a preliminary form with your utility and talk to its engineer before ordering equipment. This will help identity any requirements that you may have overlooked in the requirements document. Once you order your equipment you can complete the form with the final equipment data sheets and submit the final version.
- What brand and wattage of solar panels should you use? Start by deciding what range of panel wattage is acceptable and shopping online. Having a range of acceptable panel wattages gives you the flexibility to take advantage of low-priced options. When you find a good deal, confirm that the panels are compatible with the microinverters (if using).
- What’s the best way to ship equipment to Alaska? Some vendors may not ship to Alaska. Don’t let that stop you; you can get a quote online from a freight forwarder (Span-Alaska, Lynden) and have your vendor ship to Tacoma and your shipper will take it from there.
- How many panels should be in each string (if using string inverter)? Most inverter vendors have online tools to help figure this out.
- Should I use microinverters or a string inverter? Read up on the pros/cons of micro-vs. string inverters and decide which to use in your system. Microinverters will add somewhat to your cost but will also optimize power production and simplify the design of your system. Current electrical code requires rapid shutdown of the solar output if the grid power goes out. Any inverter that you decide to use should be capable of rapid shutdown and be UL 1741 compliant.
- What brand of inverter is best? The panels and inverters need to work together so it’s best to confirm brands and order at the same time. Most inverter manufacturers have online tools to check compatibility.
- What brand of racking is best? Your choice of racking will depend on what type of roof you have (shingle, steel). If installing on a roof, you will need to decide whether to use rail or railless system. Rail systems are the more conventional approach but railless systems are becoming more common and you have the significant advantage of not having to ship long sections of rail to Alaska. The design wind loading for your region should also be taken into account. Many racking companies have online tools that allow customers to design their racking systems online so that everything is engineered correctly. The Anchorage municipal website has a map showing wind design speed for part of Anchorage. If you live outside the map you aren’t covered by these maps. You can look up your ASCE 7-10 wind design speed here: ATC Hazards by location
- How should I route the wiring to the disconnect switch? This will most likely involve some conduit. Conduit is cheap and easy to bend with lots of online how-to’s, so don’t be discouraged by this. The electricity coming out of the inverter(s) is standard 240 V AC power. These wiring components are all available locally. While you can get most/all at standard home improvement stores, electrical supply houses offer the same or better prices and lots of good guidance. This is where code research is necessary. Buying equipment from a local electrical supply house will give you access to experienced counter guys who can be a great help in figuring out how to satisfy code requirements.
- Is ordering a complete kit an option? If all this is a bit daunting, there are many solar PV kit options available. Many solar vendors offer a predesigned kit or will provide the DIY homeowner with a design package if the solar components are purchased from them. This can be an attractive option if you are finding the design process a bit intimidating.
Once your equipment arrives and you are clear on all permitting requirements you are ready for installation. You will likely be working on a roof, so be sure to use fall protection equipment. The racking and inverter(s) will have detailed installation manuals — follow them. Make sure the equipment is all bonded and grounded correctly and that you have all the warning placards in place as required by local government and your utility. The utility may not require it but include a placard on your distribution panel to remind yourself that the panel has power feeding in from both the grid and the solar panels.
If you are not confident of your AC wiring skills and don’t have access to electrical coaching, consider hiring an electrician to do the wiring from the inverters to the distribution panel. This is a relatively small part of the overall project and will not add substantially to your cost.
Installation: Important things to remember
Working with electricity (or any other energy source) carries inherent risk. If you are not sure on how to proceed, do more research and get professional assistance; don’t guess.
There are many useful online resources, but only a few of them are referenced in the write up, so spend time doing research and educate yourself. The links below provide some helpful information.
Useful websites
Mr. Money Mustache DIY solar power
Anchorage, Alaska
Jenn Miller
Below are the high-level steps we used to install a solar grid-tie system on our house. We were able to install the system ourselves for half the cost of retailer quotes. Had shipping been less expensive and had we optimized our solar panel selection more, we may have been able to reduce our cost to 30% to 40% of the retail cost. With the low solar materials cost and the 30% federal tax credit, we found that solar was an attractive investment option, especially given other “income generation” type investment returns. The section below details our findings as we sized, analyzed, permitted, and installed our system. I’ve also listed links to useful tools and websites. We had fun designing and installing the system ourselves and I was amazed at how simple it was to install. There are more plug-type electrical connections that anyone can install and just a small portion of true electrical wiring, which we hired someone to help us with.
Determine your net metering billing period and avoided cost rate
Your utility company’s net metering billing period will determine whether you should size your system for an annual average load or for peak production months. The net metering billing period determines how often you “true up” your production with the utility company. An annual net metering billing period means you can bank production during high-sun months to cover low-sun months. A monthly net metering billing period means you can only bank production within a single month, so high-sun production days can cover low production days within the month (currently all net metering in Alaska is done based on monthly net metering billing periods). If you live in an area with consistent sun, then this may not be big differentiator, but for Alaska, with peak production in the summer and minimal during January/February, it sets the sizing basis for your system. As you get paid less for excess energy you produce (e.g., $0.056/kWh) than the cost of energy you consume (e.g. $0.22/kWh) you may not want to oversize your system as it will increase your payback time. To find the net metering billing period you can look in your utility company’s tariff manual or just call them. If your net metering billing period is monthly, then you can only offset your electricity usage during the summer and partially during fall/spring.
ML&P Net Metering Billing and Charges
ML&P Customer Billing Info (Billing Cycle)
While perusing the utility company’s tariff manual, find their published “avoided cost rate.” This is their cost savings from not having to run their equipment because of your solar power production. You’ll use this in your economics for payback for excess production.
Rates for Purchase of Energy:
The rates which ML&P will pay for energy supplied to it by the qualifying facility are the estimated average avoided costs (exclusive of the Cost of Power Balance Amount) filed with the Regulatory Commission of Alaska. The following rate for purchase of energy will changes concurrently with the power cost adjustment revisions.
The avoided cost for determining the energy rate is as follows:
- Estimated fuel expense, variable operation and maintenance expenses and the energy portion of purchased-power expense for the ensuing quarter beginning 04/01/2017
$14,692.873 (I)
- Estimated kWh sales for the ensuing quarter beginning 04/01/2017
$261,257.000
- Energy Power Rate [(1) (2)]
$0.0562/kWh (I)
Size your system using PVWatts
Pull your electrical energy usage data for the last year to determine your usage/month.
The National Renewable Energy Laboratory has developed an online solar power energy production calculator called PVWatts, which determines the approximate solar production specific to your area, mounting azimuth, and angle. You enter your address, select the nearest weather station, and then enter your system sizing and mounting location specifics and it outputs monthly power generation. It’s fast, so you can try a bunch of system sizes and see which best matches your usage. Save the monthly production values to use in your economics. For example, we use about 150 kWh/month in the summer and put in a 1.5 kW system. This covers our usage from May to August and offsets spring and fall months.
Design your system using the Renvu Solar Kit Guide
Renvu was recommended by a friend, and we found that they have competitive prices and excellent customer service. We decided to use their Solar Kit Guide, which provides a kit for 95% of your entire system (includes all materials needed except electrical to get from roof junction box to your house electrical panel or sub panel). The kit includes major equipment like panels and inverters, but also all the small miscellaneous parts you need such as roof flashing and, literally, nuts and bolts The kit also takes care of equipment bonding and grounding. You can build as many systems as you want and the Solar Kit Guide kicks out an automatic quote for each one. Another huge benefit is if you buy a kit from Renvu you can also purchase an electrical one-line drawing (required for our utility company interconnect permit). This saved having to hire an engineer to create a drawing. I recommend registering on the website; this allows you to see all the pricing information. When your build your first kit online, it will kick out a detailed bill of materials and unit pricing. You can then peruse the website to look at other solar panel costs to see if you’d like to select a cheaper option.
- Inverter Type
- String inverter: The inverter is what changes your solar power from DC to AC. A string inverter combines power from multiple panels and converts the total. Usually there’s a specified number of panels per string inverter (e.g., 8). The upside of a string inverter is that you don’t have to buy as many inverters, but the downside is if you have shading or partial shading and the minimum voltage isn’t met, then it drops out the production from all the panels. We did not install a string inverter system, so I don’t know all the ins and outs (disclaimer!)
- Microinverter: A microinverter is installed on each solar panel and the main benefit is that if
you having shading, if one panel is in the shade but the others are making enough
to satisfy their microinverter, then they’re productive and you can get higher overall
productivity than if you had a string inverter (and you have shade). This is what
we installed.

- Solar Panel Selection
- It’s useful to go back and forth between the regular Renvu website to check solar
panel costs and then select the solar panel you want in your kit. If the panel has
a minimum purchase quantity, you can call Renvu and they can break a pallet and will
charge about $100-$150, but this might save a lot of money if it allows you to buy
cheaper panels. Panels and inverters make up most of the kit cost.
For us panels and inverters were 65% of our kit cost (less shipping).
- It’s useful to go back and forth between the regular Renvu website to check solar
panel costs and then select the solar panel you want in your kit. If the panel has
a minimum purchase quantity, you can call Renvu and they can break a pallet and will
charge about $100-$150, but this might save a lot of money if it allows you to buy
cheaper panels. Panels and inverters make up most of the kit cost.
- Racking System
- UNIRAC U-Builder: We have a shingle roof and selected UNIRAC. Honestly, not really looking into it at all, we just picked one. We later found out that we needed to provide information to prove that our mounting system was suitable for our local wind and snow loads. UNIRAC has a tool called U-Builder, and you can put in your city’s published wind/snow loads and it tells you the mounting bracket maximum spacing and overhang. It also publishes an engineering report that you can use for your city permit. The other systems might have this too, but I haven’t checked. It might be worth checking your wind/snow loads with the tool to see if you require tighter than 4-foot spacing (assumed in the Renvu Solar Kit Guide). It turned out that our system needed tighter spacing than 4 feet and we had to order an additional mounting bracket after the fact.
- Monitoring
- You can select if you’d like production monitoring or not. We thought it would be really neat to see and check our production prediction, but ultimately it added 1.5 years to our payout ($400) so we didn’t buy it. We’re just planning to track our performance based on how much we save on electricity cost each year compared to our baseline cost.
- Permitting Package Option
a. We bought the permitting-electrical diagram option with our kit, which came with a one-line drawing feature (see Figure 1). There’s another option that provides equipment datasheets, and maybe it also provides the mounting information, which would be helpful. We ended up looking up major equipment online and printing the various datasheets. Maybe chat with Renvu customer service to find out what’s included — the full permitting kit might be a nice option and ease permitting woes. Also, stickers come with the permitting option and these are required for labeling your conduit, disconnect and panel so others are aware of the PV power source.
Economics
Once you’ve completed quotes for your system and have a rough idea on cost you can run economics and sensitivities on different-size systems to check the payout. These different assumptions are listed in the table below. We weren’t sure if our system production would match the 1.25 kW or 1.5 kW model production (as we have a lot of shading), so we wanted to test sensitivities on payout.
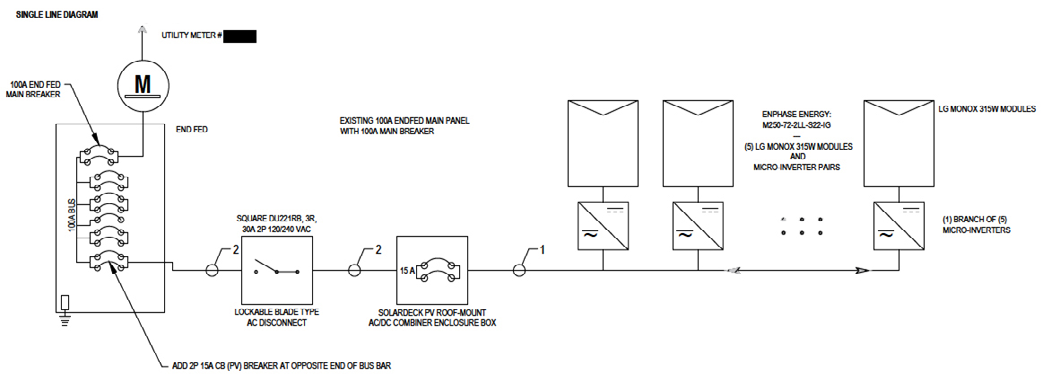
| Energy cost ($/kWh) | 0.224715 |
|
| Avoided cost rate ($/kWh) |
0.056 |
|
| Energy inflation rate | 0.06 |
|
| 1.25 kW System | 1.5 kW System |
|
| Gross system cost | $4,092 | $4,092 |
| Net system cost | $2,865 | $2,865 |
| Discount rate | 0.03 |
0.03 |
| Payout time (years) |
9–11 years | 8-9 years |
| IRR | 10.1% | 12.5% |
| 20-yr NPV (3% discount rate) |
$2,774 |
$3,929 |
| Return on investment (over 20 years) |
97% |
137% |
| Simple yearly return on investment (over 20 years) |
5% | 7% |
- Electricity Cost/kWh: Important note: Since our initial economic runs, ML&P changed its electricity rates and they’re lower. Check for the latest cost and make sure to only include the variable cost that will go away with your production and don’t take credit for any fixed costs that you’ll still have.
- Net System Cost: Right now there’s a federal tax credit for 30%. You can see the breakdown of our total system cost in the second tab in the workbook. In sum, we spent about $4,200 for a 1.5 kW system— net cost to us: $2,900.
- Energy Cost Inflation: We assumed 6% annual inflation; this might be high, but we’ll see.
- IRR: To determine the IRR we used goal seek to determine the discount rate if the cumulative discounted cash flow was 0 at 20 years. Let me know if you think of better economics analysis methods.
- Payback Period: We assumed a 3% discount factor to determine an approximate payback period.
Permitting
- Utility Interconnection Permit
- ML&P (Known now as Chugach Electric): Go to Chugach Electric for ML&P Interconnect Requirements and Tariff info. A small residential grid-tie system is classified as a Class A Net generator. The document provides pretty good guidance on the permitting process. ML&P was really easy to work with and helpful with questions. Before you purchase your materials it’s worth calling them and talking through your plans and asking them to give you an overview of their permit process. After that, you’ll kick off the official permit process by submitting a Class A Net Interconnection Application. A couple of key things we found out: (1) the Electrical One-Line Drawing does not need to be stamped by a professional engineer for residential systems, (2) you need to provide proof of liability insurance for $300,000 as part of the permitting process (this was part of our home owner’s insurance), (3) ML&P requested datasheets for major equipment, and (4) you need to ask ML&P about your current meter to make sure it can be easily upgraded to a net meter (i.e., no major electrical modifications required, this could have large cost impacts). Finally, good news: The ML&P Interconnect Requirements discuss a cost reconciliation, but they did not charge us for anything!
- Other utility companies: Locate your utility interconnect requirements. Consider some of the findings listed above and see if they may impact your requirements/install cost.
- City Building Permit: For Anchorage we had to get a building permit with a structural design sign off and
pay for structural and electrical inspections.
- Structural: For the structural permit we had to provide a sketch of how we were going to mount the system to the roof. It was key to show our L-bracket spacing and provide documentation that this spacing met the city’s wind/snow loads. This is where the online Unirac, U-Builder came to the rescue; you can put in your city’s wind/snow loads and it tells you spacing requirements and spits out a nice engineering report.
- Electrical: We included the electrical one-line drawing in our permit submittal. There wasn’t an electrical design review, just an inspection.
- Fire: For Anchorage a fire code review is not required for residential installations. I read articles online where some cities require fire code inspection and the 2012 IFC code requires spacing around your panels to allow firefighter access. Here’s a good article that summarizes the requirements.
Installation
For installation we just followed the Unirac Installation Guide. The wiring for the panels is simple plug-style connections, up to the roof junction box. We hired an electrician to advise us on connecting from the junction box to our house main panel (can also go to a subpanel) and worked together to install the final electrical. The nice thing is that the electrical one-line drawing provided by Renvu tells you which wire gauge is needed and the breaker size. Below are the high-level install steps. These will vary depending on your roof style and mounting system.
- Mount Rail L Brackets to Roof: Locate your rafters as best you can and drill bolt holes through roof. We definitely missed a few, but these were covered up by the mounting flashing. For this step you drill the bolt hole, loosen the shingles above your hole, slip the mounting flashing up under the shingles, and screw the L bracket to the roof. We used a roof sealant on the flashing and gooped up the L bracket to ensure no roof leaks. This wasn’t part of the instructions and will make it annoying if we have to modify these in the future, but we saw it as a low risk and wanted to prevent any roof leaks!
- Attach Rails to L Brackets
- Mount Microinverters Along Rail and Connect Each to Trunk Cable: It’s important to check your microinverter spacing and location to make sure the
end of the trunk cable will meet your roof junction box. We had to shift our microinverters
so they were to the far side of each panel so the trunk cable would meet the junction
box.
- Attach End Clamp to Rail and Mount First Solar Panel: Make sure to make plug-in connections between microinverter and solar panel before you tighten the panel down as it will be difficult to reach once the panel is on top. Setting the first panel is a bit of a pain, but once it’s lined up the rest get easier. Basically, on the first and last panel there’s an end clamp that secures the panel to the rail and then mid clamps between each panel.
- Connect Equipment Ground Wire on Last End Clamp: (provided with kit)
- Terminate the Trunk Cable and Equipment Ground Wire in Roof Termination Box (e.g., Soladeck, roof mount).
- Run Electrical to Disconnect and Final Electrical Panel: Here’s where we sought guidance from an electrician. At a high level we ran wire from the roof termination box, through our attic, back outside to a lockable disconnect box (provided with the kit), accessible from ground height (ML&P requirement) and from the disconnect box to our main electrical panel. The kit came with the roof termination box and the disconnect.
Appendix D: F-Charts
Explanation of Terms in the F-chart Performance Tables
Thermal Output
- Solar column is the solar energy collected by the solar system each month, with an annual sum for the year (bottom row).
- DHW is the Btu required to raise the water temperature to 130°F for a hot water demand of 40 gallon/day as used in all subsequent runs.
- Aux is the amount of backup heating required, in this case from an oil-fired boiler.
- f column is the fractional percentage of energy provided each month by the solar collectors, and the annual fraction is the final total fraction for the year.
Assumptions
- Water volume/collector: The ratio of the auxiliary water storage tank volume (or size) to collector area. Value used is 1.5, so for a 64 ft2 collector area, a storage tank on the order of 80 to 100 gallons is anticipated.
- Fuel: This is the backup fuel, which is used to heat water when solar energy is inadequate. In most cases it is fuel oil, but in Anchorage and the Matanuska-Susitna area gas is modeled too.
- Efficiency of fuel usage: This is typically 80%, the conservative value for combustion efficiency for both fuel oil and natural gas backup options.
- Daily hot water usage: 40 gallons/day for all locations.
- Water set temperature: 130°F for all locations.
- Environmental temperature: The ambient temperature of the space where the hot water heater and/or storage tank is/are located. Always assumed 68°F, indoors.
- UA of auxiliary storage tank: Heat loss rate from a modestly insulated, typical hot water storage tank (about equal to two inches of fiber-glass).
- Pipe heat loss: None assumed. Pipes are assumed to be insulated. Clearly this is an optimistic assumption, but the losses heat the space inside the building, which is mostly a positive.
- Collector-store heat exchanger: Assumes typical flow rate and heat exchanger effectiveness. Used in all locations.
TABLE AC-2: Anchorage Airport Weather Data, Natural Gas Rate, Enstar
$.98/therm backup fuel, 90° collector tilt, south 64 ft2, Heliodyne spec.
| Solar (106 Btu) | DHW (106 Btu) | Aux (106 Btu) | f Solar fraction | |
|---|---|---|---|---|
| Jan | 0.856 | 1.302 | 1.097 | 0.158 |
| Feb | 1.636 | 1.189 | 0.560 | 0.529 |
| Mar | 2.018 | 1.314 | 0.543 | 0.587 |
| Apr | 2.016 | 1.253 | 0.480 | 0.617 |
| May | 1.913 | 1.263 | 0.527 | 0.583 |
| June | 2.090 | 1.190 | 0.412 | 0.654 |
| July | 1.902 | 1.193 | 0.491 | 0.589 |
| Aug | 1.873 | 1.178 | 0.496 | 0.579 |
| Sep | 1.513 0.452 | 1.142 | 0.598 | 0.477 |
| Oct | 1.268 | 1.200 | 0.793 | 0.339 |
| Nov | 1.154 | 1.192 | 0.838 | 0.297 |
| Dec | 0.636 | 1.263 | 1.211 | 0.042 |
| Year | 18.873 | 14.678 | 8.044 | 0.452 |
TABLE AC-3: Anchorage Airport Weather Data, Enstar Natural Gas
$.98/therm backup fuel, 60° tilt, south
| Solar (106 Btu) | DHW (106 Btu) | Aux (106 Btu) | f Solar fraction | |
|---|---|---|---|---|
| Jan | 0.834 | 1.752 | 1.647 | 0.060 |
| Feb | 1.371 | 1.580 | 1.144 | 0.276 |
| Mar | 2.363 | 1.744 | 0.871 | 0.501 |
| Apr | 2.653 | 1.680 | 0.655 | 0.610 |
| May | 2.748 | 1.729 | 0.646 | 0.626 |
| June | 2.638 | 1.667 | 0.589 | 0.646 |
| July | 2.662 | 1.719 | 0.616 | 0.642 |
| Aug | 2.344 | 1.721 | 0.741 | 0.569 |
| Sep | 1.816 | 1.671 | 0.940 | 0.438 |
| Oct | 1.409 | 1.738 | 1.249 | 0.281 |
| Nov | 0.952 | 1.691 | 1.481 | 0.124 |
| Dec | 0.532 | 1.752 | 1.752 | 0.000 |
| Year | 22.321 | 20.445 | 12.332 | 0.397 |
Comparison with a 90° tilt run (Table AC-2 Anch.) shows Anchorage solar water heating to be marginally cost effective at present natural gas prices. Also, the fraction of solar heating is too small (.397, ~40%) to qualify for the federal tax credit. To receive the federal tax credit, the solar fraction annually must be at least 50%.
TABLE AC-4: Anchorage, Merrill Field Weather Data
Oil-only backup, 64 ft2, 90° tilt
| Solar (106 Btu) | DHW (106 Btu) | Aux (106 Btu) | f Solar fraction | |
|---|---|---|---|---|
| Jan | 0.562 | 1.262 | 1.225 | 0.029 |
| Feb | 1.245 | 1.149 | 0.722 | 0.372 |
| Mar | 1.628 | 1.269 | 0.689 | 0.457 |
| Apr | 1.650 | 1.213 | 0.627 | 0.483 |
| May | 1.549 | 1.228 | 0.675 | 0.450 |
| June | 2.084 | 1.164 | 0.399 | 0.657 |
| July | 1.884 | 1.175 | 0.499 | 0.576 |
| Aug | 1.865 | 1.165 | 0.480 | 0.588 |
| Sep | 1.789 | 1.130 | 0.502 | 0.556 |
| Oct | 1.201 | 1.184 | 0.818 | 0.309 |
| Nov | 0.761 | 1.170 | 1.009 | 0.138 |
| Dec | 0.438 | 1.233 | 1.233 | 0.000 |
| Year | 16.656 | 14.342 | 8.878 | 0.381 |
This was a test to see what the performance in Anchorage would be if one did not have natural gas access. Anchorage is for all cases marginal for solar domestic hot water. The following test is for a 64°tilt with oil backup. This test was done for the data at Merrill Field ,which is more residential than the Airport data used in the previous runs for Anchorage.
TABLE AC-5: Anchorage Merrill Field
60° tilt, oil-only backup
| Solar (106 Btu) | DHW (106 Btu) | Aux (106 Btu) | f Solar fraction | |
|---|---|---|---|---|
| Jan | 0.538 |
1.262 | 1.246 | 0.013 |
| Feb | 1.268 | 1.149 | 0.714 | 0.379 |
| Mar | 1.854 | 1.269 | 0.582 | 0.541 |
| Apr | 2.090 | 1.213 | 0.421 | 0.653 |
| May | 2.160 | 1.228 | 0.408 | 0.668 |
| June | 2.961 | 1.164 | 0.072 | 0.938 |
| July | 2.656 | 1.175 | 0.202 | 0.828 |
| Aug | 2.457 | 1.165 | 0.239 | 0.795 |
| Sep | 2.116 | 1.130 | 0.365 | 0.677 |
| Oct | 1.273 | 1.184 | 0.784 | 0.338 |
| Nov | 0.739 | 1.170 | 1.028 | 0.122 |
| Dec | 0.411 | 1.233 | 1.233 | 0.000 |
| Year | 20.523 | 14.342 | 7.294 | 0.491 |
With a 60°tilt and oil backup, solar performance is nearly good enough to qualify for the federal tax credit, but not quite. An economic analysis of bigger collector areas and whether they are competitive is worth pursuing, but as long as natural gas dominates, only the zealous are likely to pursue solar hot water systems in Anchorage.
TABLE AC-6: Barrow
90°, natural gas backup
| Solar (106 Btu) | DHW (106 Btu) | Aux (106 Btu) | f Solar fraction | |
|---|---|---|---|---|
| Jan | 0.000 | 1.529 | 1.529 | 0.000 |
| Feb | 1.149 | 1.387 | 0.960 | 0.308 |
| Mar | 2.633 | 1.539 | 0.470 | 0.695 |
| Apr | 3.374 | 1.488 | 0.180 | 0.879 |
| May | 2.537 | 1.533 | 0.441 | 0.712 |
| June | 1.825 | 1.477 | 0.630 | 0.573 |
| July | 1.947 | 1.516 | 0.596 | 0.607 |
| Aug | 1.615 | 1.509 | 0.704 | 0.534 |
| Sep | 1.255 | 1.457 | 0.864 | 0.407 |
| Oct | 1.576 | 1.507 | 0.779 | 0.483 |
| Nov | 0.000 | 1.463 | 1.463 | 0.000 |
| Dec | 0.000 |
1.518 |
1.518 |
0.000 |
| Year | 17.912 | 17.923 | 10.135 | 0.435 |
Although even competing with inexpensive natural gas, solar heating with a 90° tilt comes close to a 50% fraction, it still doesn’t meet the 50% minimum for the federal tax credit. A 90° tilt is not optimum for Barrow compared to a 60° tilt (which yields a theoretical 48.7% annual solar fraction), but it avoids the snow cover.
TABLE AC-7: Bethel Airport
Oil backup, 60° tilt
| Solar (106 Btu) | DHW (106 Btu) | Aux (106 Btu) | f Solar fraction | |
|---|---|---|---|---|
| Jan | 1.013 | 1.344 | 1.039 | 0.227 |
| Feb | 2.108 | 1.228 | 0.400 | 0.674 |
| Mar | 3.066 | 1.360 | 0.222 | 0.837 |
| Apr | 3.068 | 1.302 | 0.125 | 0.904 |
| May | 2.656 | 1.320 | 0.259 | 0.804 |
| June | 2.448 | 1.251 | 0.252 | 0.798 |
| July | 2.494 | 1.261 | 0.260 | 0.794 |
| Aug | 1.976 | 1.245 | 0.451 | 0.638 |
| Sep | 1.675 | 1.204 | 0.552 | 0.541 |
| Oct | 1.491 | 1.258 | 0.715 | 0.432 |
| Nov | 1.305 | 1.242 | 0.800 | 0.356 |
| Dec | 0.846 | 1.310 | 1.132 | 0.136 |
| Year | 24.147 | 15.326 | 6.208 | 0.595 |
Bethel is clearly a good candidate location for solar hot water systems, and probably is a good representation of the lower Kuskokwim basin, at least the inland locations. It is also a place where, like Nome and Kotzebue, it may be feasible to use a 60° tilt because regular wind would keep a solar collector free of snow. See the following table for the results of a Bethel system at a 90° tilt.
TABLE AC-8: Bethel Airport
90° tilt, oil backup at $5 per gallon
| Solar (106 Btu) | DHW (106 Btu) | Aux (106 Btu) | f Solar fraction | |
|---|---|---|---|---|
| Jan | 1.105 | 1.344 | 0.982 | 0.269 |
| Feb | 2.205 | 1.228 | 0.365 | 0.703 |
| Mar | 3.004 | 1.360 | 0.259 | 0.810 |
| Apr | 2.581 | 1.302 | 0.314 | 0.759 |
| May | 1.882 | 1.320 | 0.575 | 0.565 |
| June | 1.731 | 1.251 | 0.573 | 0.542 |
| July | 1.768 | 1.261 | 0.567 | 0.550 |
| Aug | 1.494 | 1.245 | 0.683 | 0.451 |
| Sep | 1.398 |
1.204 | 0.690 | 0.427 |
| Oct | 1.448 | 1.258 | 0.736 | 0.415 |
| Nov | 1.409 | 1.242 | 0.744 | 0.401 |
| Dec | 0.935 | 1.310 | 1.074 | 0.180 |
| Year | 20.962 | 15.326 | 7.560 | 0.507 |
The comparison of this run, which is for 90° presents an interesting result. The 90° tilt would theoretically lower the annual solar fraction by 17%, from 59.5% to 50.7%. It seems worthwhile to use a 60° tilt and see if the wind works keeps the collectors free of snow.
TABLE AC-9: Big Delta
60° tilt, $3 per gallon, fuel oil backup
| Solar (106 Btu) | DHW (106 Btu) | Aux (106 Btu) | f Solar fraction | |
|---|---|---|---|---|
| Jan | 1.000 | 1.367 | 0.207 |
|
| Feb | 1.541 | 1.253 | 0.659 | 0.474 |
| Mar | 2.824 | 1.388 | 0.299 | 0.785 |
| Apr | 3.424 | 1.327 | 0.010 | 0.993 |
| May | 2.182 | 1.339 | 0.390 | 0.708 |
| June | 2.778 | 1.261 | 0.078 | 0.938 |
| July | 3.476 | 1.261 | 0.000 | 1.000 |
| Aug | 2.774 | 1.240 | 0.172 | 0.862 |
| Sep | 2.133 | 1.198 | 0.362 | 0.698 |
| Oct | 1.804 | 1.256 | 0.596 |
0.526 |
| Nov | 1.337 | 1.247 | 0.839 | 0.328 |
| Dec | 0.736 | 1.323 | 1.218 | 0.079 |
| Year | 26.011 | 15.461 | 5.708 | 0.631 |
Big Delta is a very promising place for solar hot water, and it is not surprising. Annual solar fraction is 63.1%, which is one of the highest in the state. It also may be a good place to attempt using a 60°tilt as it is regularly windy enough to sweep snow off the solar collectors. See the following comparative run for Big Delta performance at a 90° tilt.
TABLE AC-10: Big Delta
90° tilt, fuel oil backup
| Solar (106 Btu) | DHW (106 Btu) | Aux (106 Btu) | f Solar fraction | |
|---|---|---|---|---|
| Jan | 1.117 | 1.367 | 1.011 | 0.260 |
| Feb | 1.635 | 1.253 | 0.613 | 0.510 |
| Mar | 2.807 | 1.388 | 0.319 | 0.770 |
| Apr | 2.795 | 1.327 | 0.225 | 0.831 |
| May | 1.599 | 1.339 | 0.658 | 0.509 |
| June | 2.009 | 1.261 | 0.406 | 0.678 |
| July | 2.523 | 1.261 | 0.260 | 0.794 |
| Aug | 2.143 | 1.240 | 0.412 | 0.668 |
| Sep | 1.844 | 1.198 | 0.4866 | 0.594 |
| Oct | 1.876 | 1.256 | 0.566 | 0.550 |
| Nov | 1.476 | 1.247 | 0.764 | 0.388 |
| Dec | 0.833 | 1.323 | 1.152 | 0.129 |
| Year | 22.657 | 15.461 | 6.871 | 0.556 |
As in Bethel, the performance of the 90° tilt in Big Delta is less than the performance of the 60° tilt system (less by 13.5%). Since Delta is a wind-prone place, it may be worth going with the 60° tilt. Both cases more than adequately qualify for the federal solar tax credit.
TABLE AC-11: Cordova
90° tilt, fuel oil backup
| Solar (106 Btu) | DHW (106 Btu) | Aux (106 Btu) | f Solar fraction | |
|---|---|---|---|---|
| Jan | 0.762 | 1.255 | 1.099 | 0.124 |
| Feb | 0.781 | 1.141 | 0.948 | 0.169 |
| Mar | 1.135 | 1.261 | 0.907 | 0.280 |
| Apr | 1.712 | 1.208 | 0.581 | 0.519 |
| May | 1.680 | 1.228 | 0.635 | 0.483 |
| June | 1.702 | 1.169 | 0.569 | 0.513 |
| July | 1.292 | 1.187 | 0.772 | 0.349 |
| Aug | 1.627 | 1.178 | 0.611 | 0.481 |
| Sep | 1.688 | 1.142 | 0.532 | 0.535 |
| Oct | 1.529 | 1.193 | 0.664 | 0.443 |
| Nov | 1.039 | 1.174 | 0.872 | 0.257 |
| Dec | 0.626 | 1.232 | 1.177 | 0.044 |
| Year | 15.572 | 14.368 | 9.368 | 0.348 |
Cordova, like many south coastal and Aleutian sites, is unpromising as a solar water heating location. But it does have renewable electricity from a hydroelectric dam, which is an excellent renewable alternative to solar water heating.
ABLE AC-12: Dillingham
60° run. Fuel oil back up, $5 per gallon
| Solar (106 Btu) | DHW (106 Btu) | Aux (106 Btu) | f Solar fraction | |
|---|---|---|---|---|
| Jan | 0.559 | 1.292 | 1.260 | 0.025 |
| Feb | 0.691 | 1.176 | 1.015 | 0.137 |
| Mar | 1.584 | 1.301 | 0.715 | 0.450 |
| Apr | 1.976 | 1.247 | 0.492 | 0.605 |
| May | 3.438 | 1.267 | 0.060 | 0.952 |
| June | 2.114 | 1.206 | 0.376 | 0.688 |
| July | 2.237 | 1.222 | 0.363 | 0.703 |
| Aug | 1.801 | 1.211 | 0.519 | 0.571 |
| Sep | 1.655 | 1.173 | 0.566 | 0.517 |
| Oct | 1.521 | 1.225 | 0.707 | 0.423 |
| Nov | 0.487 | 1.206 | 1.206 |
0.000 |
| Dec | 0.439 | 1.266 | 1.266 | 0.000 |
| Year | 18.500 | 14.791 | 8.546 | 0.422 |
Although Dillingham does not appear to be a good candidate location for solar water heating, there are some very interesting and unusual patterns in the solar performance by month data that are worth commenting on. Compare, for instance the 95% solar fraction in May with the 68.8% solar fraction in June. This is a radical switch and reflects the coastal climate, which clouds quickly in summer. Also, the March solar fraction is much worse than many locations in Alaska, probably because the coastal cloudiness influence and unstable ice cover on the Nushagak River (due to tidal influences), limiting snow reflectance. Note that the solar gain for the three coldest months is nearly zero, a good indication of cloudy coastal winter as well.
TABLE AC-13: Dutch Harbor
60° tilt, fuel oil backup
| Solar (106 Btu) | DHW (106 Btu) | Aux (106 Btu) | f Solar fraction | |
|---|---|---|---|---|
| Jan | 0.507 | 1.238 | 1.238 | 0.000 |
| Feb | 0.630 | 1.123 | 1.026 | 0.087 |
| Mar | 0.960 | 1.242 | 1.006 | 0.190 |
| Apr | 1.363 | 1.193 | 0.736 | 0.383 |
| May | 1.535 | 1.219 | 0.698 | 0.427 |
| June | 1.725 | 1.166 | 0.556 | 0.524 |
| July | 1.904 | 1.190 | 0.503 | 0.577 |
| Aug | 1.883 | 1.184 | 0.485 | 0.590 |
| Sep | 1.162 | 1.148 | 0.775 | 0.325 |
| Oct | 0.968 | 1.195 | 0.937 | 0.216 |
| Nov | 0.563 | 1.170 | 1.127 | 0.036 |
| Dec | 0.496 | 1.222 | 1.222 | 0.000 |
| Year | 13.696 | 14.292 | 10.311 | 0.279 |
Harbor will simply never be a solar haven and that’s what makes it a good fishing port. It is simply too cloudy too much of the year to attempt solar hot water heating.
TABLE AC-14: Fairbanks
90° tilt, 64 ft2 Heliodyne, Fuel oil backup $3 per gallon
| Solar (106 Btu) | DHW (106 Btu) | Aux (106 Btu) | f Solar fraction | |
|---|---|---|---|---|
| Jan | 1.131 | 1.384 | 1.029 | 0.257 |
| Feb | 1.614 | 1.270 | 0.637 | 0.498 |
| Mar | 3.025 | 1.409 | 0.244 | 0.826 |
| Apr | 3.182 | 1.347 | 0.109 | 0.919 |
| May | 2.486 | 1.358 | 0.305 | 0.776 |
| June | 2.258 | 1.278 | 0.335 | 0.738 |
| July | 2.237 | 1.275 | 0.352 | 0.724 |
| Aug | 2.214 | 1.252 | 0.365 | 0.708 |
| Sep | 1.762 | 1.209 | 0.526 | 0.565 |
| Oct | 1.707 | 1.267 | 0.625 | 0.507 |
| Nov | 1.139 | 1.259 | 0.944 | 0.250 |
| Dec | 0.527 | 1.337 | 1.337 | 0.000 |
| Year | 23.283 | 15.645 | 6.809 | 0.565 |
Several things are noteworthy for this very familiar Fairbanks situation (to the author anyway!). The 90° tilt has been run first here to test its worthiness for recommendation. Since the annual solar fraction is well above 50%, it is indeed deemed a very worthy tilt choice, judging from the photos at the beginning of this chapter and the discussion of snow accumulation issues if a 60° tilt (or latitude tilt: 65 degrees) is used. This is the primary example for mounting in Fairbanks and much of the Interior of Alaska, and would also serve well in much of Canada north of 60 degrees latitude. To further examine the annual performance a monthly contribution plot of the solar energy fraction for a 64 ft2 collector area is included for this run, and follows here:
TABLE AC-15: Fairbanks
60°tilt, 64 ft2 Heliodyne, Fuel oil backup $3 per gallon
| Solar (106 Btu) | DHW (106 Btu) | Aux (106 Btu) | f Solar fraction | |
|---|---|---|---|---|
| Jan | 0.639 | 1.407 | 1.407 | 0.000 |
| Feb | 1.465 | 1.267 | 0.831 | 0.344 |
| Mar | 2.967 | 1.396 | 0.369 | 0.735 |
| Apr | 3.368 | 1.341 | 0.127 | 0.905 |
| May | 3.237 | 1.376 | 0.127 | 0.907 |
| June | 3.101 | 1.326 | 0.066 | 0.950 |
| July | 3.054 | 1.369 | 0.105 | 0.924 |
| Aug | 2.634 | 1.372 | 0.269 | 0.804 |
| Sep | 2.060 | 1.334 | 0.480 | 0.640 |
| Oct | 1.468 | 1.388 | 0.859 | 0.381 |
| Nov | 0.948 | 1.355 | 1.160 | 0.144 |
| Dec | 0.217 | 1.405 | 1.405 | 0.000 |
| Year | 25.158 | 16.334 | 7.206 | 0.559 |
The comparison to the previous Fairbanks F-chart calculation for a 90° tilt collector is very surprising. Although summer performance is much better for a 60° tilt, the annual fraction for solar heating, comparing a 60° tilt with a 90° tilt, is virtually equal. This is very reassuring in that a vertical (south wall ,for instance) collector tilt will be trouble-free, with virtually no sacrifice in annual performance. In fact the 90° tilt may serve to limit overheating problems in the summer.
TABLE AC-16: Gustavus (Southeast)
90° tilt, 64 ft2, $3 per gallon fuel oil
| Solar (106 Btu) | DHW (106 Btu) | Aux (106 Btu) | f Solar fraction | |
|---|---|---|---|---|
| Jan | 0.969 | 1.247 | 0.968 | 0.223 |
| Feb | 1.530 | 1.133 | 0.560 | 0.506 |
| Mar | 2.786 | 1.252 | 0.249 | 0.801 |
| Apr | 2.773 | 1.199 | 0.214 | 0.822 |
| May | 2.020 | 1.219 | 0.500 | 0.590 |
| June | 1.706 | 1.161 | 0.579 | 0.502 |
| July | 1.425 | 1.179 | 0.710 | 0.398 |
| Aug | 1.787 | 1.171 | 0.548 |
0.532 |
| Sep | 2.101 | 1.136 | 0.383 |
0.663 |
| Oct | 1.449 | 1.186 | 0.674 |
0.432 |
| Nov | 1.564 | 1.167 | 0.613 |
0.475 |
| Dec | 0.859 | 1.224 | 1.041 |
0.150 |
| Year | 20.970 | 14.274 | 7.037 | 0.507 |
Gustavus is a somewhat weather-sheltered community in Southeast Alaska and has one of the best climates for possible solar energy applications in the area. This 90° tilt is the best option and it (just) barely makes the 50% limit for solar heating, which would qualify for the federal tax credit. It is also the closest data set, which is comparable to Haines, that may also have potential for solar hot water heating. Haines already has a substantial number of solar energy users who are successfully living with photovoltaic systems, so the potential is certainly worth pursuing in this area of Southeast Alaska.
TABLE AC-17: Gustavus
60° tilt, 64 ft2 Heliodyne, $3 per gallon fuel oil backup
| Solar (106 Btu) | DHW (106 Btu) | Aux (106 Btu) | f Solar fraction | |
|---|---|---|---|---|
| Jan | 0.906 | 1.247 |
1.008 | 0.192 |
| Feb | 1.492 | 1.133 | 0.574 | 0.493 |
| Mar | 2.876 | 1.252 | 0.204 | 0.837 |
| Apr | 3.544 | 1.199 | 0.000 | 1.000 |
| May | 2.920 | 1.219 | 0.172 | 0.859 |
| June | 2.466 |
1.161 | 0.260 | 0.776 |
| July | 2.022 | 1.179 | 0.438 | 0.629 |
| Aug | 2.396 |
1.171 | 0.290 | 0.752 |
| Sep | 2.523 | 1.136 | 0.225 | 0.802 |
| Oct | 1.561 | 1.186 | 0.622 | 0.476 |
| Nov | 1.469 | 1.167 | 0.658 | 0.436 |
| Dec | 0.793 | 1.224 | 1.084 | 0.115 |
| Year | 24.968 | 14.274 | 5.535 | 0.612 |
Clearly Gustavus is a good solar site, and the predictions are nearly as good as for Interior Alaska for annual performance at this tilt. A 60° tilt, however, is problematic for snow accumulation, as it is everywhere in Alaska. An interesting feature of the Gustavus comparison is the large difference between the performance of a collector system at 90 ° (~50% annual fraction) and the 60° performance (~61% annual fraction). This is due entirely to better summer weather and consequent better solar performance. Winters are MUCH cloudier in Southeast Alaska. So even though the performance is better theoretically, the snow cover/accumulation issue would still encourage a vertical wall collector mount (90°).
TABLE AC-18: Homer
60° tilt, 64 ft2 Heliodyne, fuel oil backup, $3 per gallon
| Solar (106 Btu) | DHW (106 Btu) | Aux (106 Btu) | f Solar fraction | |
|---|---|---|---|---|
| Jan | 0.732 | 1.273 | 1.142 | 0.103 |
| Feb | 1.503 | 1.159 | 0.604 | 0.478 |
| Mar | 2.688 | 1.281 | 0.282 | 0.780 |
| Apr | 2.035 | 1.225 | 0.435 | 0.645 |
| May | 2.416 | 1.242 | 0.329 | 0.735 |
| June | 2.758 | 1.179 | 0.164 | 0.861 |
| July | 2.340 | 1.191 | 0.318 | 0.733 |
| Aug | 2.692 | 1.180 | 0.188 | 0.841 |
| Sep | 1.609 | 1.144 | 0.551 | 0.519 |
| Oct | 1.604 | 1.198 | 0.608 | 0.492 |
| Nov | 1.516 | 1.182 | 0.650 | 0.450 |
| Dec | 0.578 | 1.245 | 1.235 | 0.008 |
| Year | 22.471 | 14.499 | 6.506 | 0.551 |
Homer shows good potential with a 60° tilt, comfortably surpassing the 50% minimum annual production, which satisfies the federal tax credit.
TABLE AC-19: Homer
90°tilt, 64 ft2 Heliodyne, $3 per gallon fuel oil backup
| Solar (106 Btu) | DHW (106 Btu) | Aux (106 Btu) | f Solar fraction | |
|---|---|---|---|---|
| Jan | 0.787 | 1.273 | 1.105 | 0.132 |
| Feb | 1.553 | 1.159 | 0.584 | 0.497 |
| Mar | 2.618 | 1.281 | 0.322 | 0.749 |
| Apr | 1.591 | 1.225 | 0.649 | 0.471 |
| May | 1.705 | 1.242 | 0.625 | 0.496 |
| June | 1.917 | 1.179 | 0.496 | 0.579 |
| July | 1.649 | 1.191 | 0.610 | 0.488 |
| Aug | 2.024 | 1.180 | 0.447 | 0.621 |
| Sep | 1.329 | 1.144 | 0.689 | 0.398 |
| Oct | 1.509 | 1.198 | 0.650 | 0.457 |
| Nov | 1.628 | 1.182 | 0.597 | 0.495 |
| Dec | 0.629 | 1.245 | 1.199 | 0.037 |
| Year | 18.938 | 14.499 | 7.973 | 0.450 |
This result presents an interesting question and conundrum. Why is the Homer performance so much worse than even Gustavus? The answer seems to be in the data for the months of April through July. Although the solar fraction for March is nearly 75%, it drops precipitously in April to only 47% and does not really recover until August. The conclusion? Homer is much cloudier than many other locations. A solution to this may be simply a larger solar collector, as summer overheating would be less likely to be a problem judging from the data.
TABLE AC-20: Juneau
60° tilt, 64 ft2 Heliodyne, $3 per gallon fuel oil backup
| Solar (106 Btu) | DHW (106 Btu) | Aux (106 Btu) | f Solar fraction | |
|---|---|---|---|---|
| Jan | 0.752 | 1.251 | 1.123 | 0.102 |
| Feb | 1.299 | 1.140 | 0.675 | 0.408 |
| Mar | 1.554 | 1.257 | 0.704 | 0.440 |
| Apr | 2.402 | 1.198 | 0.283 | 0.764 |
| May | 2.915 | 1.209 | 0.152 | 0.875 |
| June | 2.379 | 1.142 | 0.269 | 0.764 |
| July | 1.951 | 1.149 | 0.447 | 0.611 |
| Aug | 2.587 | 1.138 | 0.222 | 0.805 |
| Sep | 1.496 | 1.105 | 0.589 | 0.467 |
| Oct | 1.400 | 1.162 | 0.689 | 0.407 |
| Nov | 0.967 | 1.153 | 0.898 | 0.221 |
| Dec | 0.581 | 1.219 | 1.201 | 0.014 |
| Year | 20.283 | 14.122 | 7.252 | 0.486 |
The Juneau performance for a 60° tilt does not show promise. It does not meet the 50% minimum, and the near-latitude tilt is vulnerable to the irregular, but often significant, snow cover maintenance anticipated in Juneau.
TABLE AC-21: Juneau 90°tilt, 64 ft2 Heliodyne, $3 per gallon fuel oil backup
| Solar (106 Btu) | DHW (106 Btu) | Aux (106 Btu) | f Solar fraction | |
|---|---|---|---|---|
| Jan | 0.778 | 1.251 | 1.103 | 0.118 |
| Feb | 1.270 | 1.140 | 0.689 | 0.396 |
| Mar | 1.321 | 1.257 | 0.824 | 0.345 |
| Apr | 1.866 | 1.198 | 0.515 | 0.570 |
| May | 2.016 | 1.209 | 0.478 | 0.604 |
| June | 1.649 | 1.142 | 0.579 | 0.493 |
| July | 1.377 | 1.149 | 0.709 | 0.383 |
| Aug | 1.928 | 1.138 | 0.480 | 0.578 |
| Sep | 1.220 | 1.105 | 0.728 | 0.341 |
| Oct | 1.290 | 1.162 | 0.742 | 0.361 |
| Nov | 0.989 | 1.153 | 0.882 | 0.235 |
| Dec | 0.609 | 1.219 | 1.178 | 0.033 |
| Year | 16.313 | 14.122 | 8.907 | 0.369 |
Juneau turns out to be quite as dismal as most resident might expect. The 90° tilt (south wall) performance doesn’t provide any consolation.
TABLE AC-22: Kenai
60°tilt, 64 ft2 Heliodyne, $3 per gallon fuel oil
| Solar (106 Btu) | DHW (106 Btu) | Aux (106 Btu) | f Solar fraction | |
|---|---|---|---|---|
| Jan | 0.844 | 1.275 | 1.063 | 0.166 |
| Feb | 0.919 | 1.160 | 0.875 | 0.246 |
| Mar | 2.549 | 1.283 | 0.327 | 0.745 |
| Apr | 3.020 | 1.229 | 0.112 | 0.909 |
| May | 2.903 | 1.249 | 0.185 | 0.852 |
| June | 2.944 | 1.188 | 0.106 | 0.911 |
| July | 2.614 | 1.204 | 0.231 | 0.808 |
| Aug | 2.811 | 1.195 | 0.163 | 0.863 |
| Sep | 3.050 | 1.158 | 0.076 | 0.934 |
| Oct | 1.606 | 1.209 | 0.663 | 0.452 |
| Nov | 0.778 | 1.190 | 1.059 | 0.110 |
| Dec | 0.474 | 1.250 | 1.250 | 0.000 |
| Year | 24.512 | 14.591 | 6.112 | 0.581 |
The 60° tilt performance looks quite promising, but a caution for residents: the run is made using fuel oil as a backup option and there are less expensive but diminishing supplies of natural gas available in the Kenai/Soldotna area, which would make the economics of the solar option worse. A good comparison with the 90° tilt, which follows, will be instructive. That is followed by a comparison with natural gas as a backup fuel, also at 90° to eliminate the snow maintenance issues.
TABLE AC-23: Kenai
90° tilt, 64 ft2 Heliodyne, $3 per gallon fuel oil
| Solar (106 Btu) | DHW (106 Btu) | Aux (106 Btu) | f Solar fraction | |
|---|---|---|---|---|
| Jan | 0.917 | 1.275 | 1.016 | 0.203 |
| Feb | 0.944 | 1.160 | 0.861 | 0.258 |
| Mar | 2.491 | 1.283 | 0.363 | 0.717 |
| Apr | 2.395 | 1.229 | 0.339 | 0.724 |
| May | 2.046 | 1.249 | 0.500 | 0.600 |
| June | 2.058 | 1.188 | 0.443 | 0.627 |
| July | 1.845 | 1.204 | 0.536 | 0.555 |
| Aug | 2.126 | 1.195 | 0.421 | 0.647 |
| Sep | 2.603 | 1.158 | 0.216 | 0.813 |
| Oct | 1.635 | 1.209 | 0.653 | 0.460 |
| Nov | 0.831 | 1.190 | 1.025 | 0.139 |
| Dec | 0.518 | 1.250 | 1.247 | 0.002 |
| Year | 20.408 | 14.591 | 7.621 | 0.478 |
A conundrum again: In comparison to a backup fuel of heating oil, the 60° tilt option is quite a good one theoretically, but a south wall mounted collector array (shown in this data set) doesn’t make the 50% minimum.
TABLE AC-24: Kenai
60° tilt, 64 ft2 Heliodyne, natural gas at $1 per 100 ft3
| Solar (106 Btu) | DHW (106 Btu) | Aux (106 Btu) | f Solar fraction | |
|---|---|---|---|---|
| Jan | 0.844 | 1.275 | 1.063 | 0.166 |
| Feb | 0.919 | 1.160 | 0.875 | 0.246 |
| Mar | 2.549 | 1.283 | 0.327 | 0.745 |
| Apr | 3.020 | 1.229 | 0.112 | 0.909 |
| May | 2.903 | 1.249 | 0.185 | 0.852 |
| June | 2.944 | 1.188 | 0.106 | 0.911 |
| July | 2.614 | 1.204 | 0.231 | 0.808 |
| Aug | 2.811 | 1.195 | 0.163 | 0.863 |
| Sep | 3.050 | 1.158 | 0.076 | 0.934 |
| Oct | 1.606 | 1.209 | 0.663 | 0.452 |
| Nov | 0.778 | 1.190 | 1.059 | 0.110 |
| Dec | 0.474 | 1.250 | 1.250 | 0.000 |
| Year | 24.512 | 14.591 | 6.112 | 0.581 |
Apparently the lower cost of natural gas is not a significant economic driver of the optimum solar system performance for the Kenai/Soldotna case. An interesting result is this performance result is identical to the one that used fuel oil as a backup fuel.
TABLE AC-25: King Salmon
60° tilt, Heliodyne 64 ft2, fuel oil at $5 per gallon
| Solar (106 Btu) | DHW (106 Btu) | Aux (106 Btu) | f Solar fraction | |
|---|---|---|---|---|
| Jan |
1.029 | 1.308 | 1.002 | 0.234 |
| Feb | 1.522 | 1.193 | 0.613 | 0.486 |
| Mar | 2.459 | 1.320 | 0.396 | 0.700 |
| Apr | 2.303 | 1.262 | 0.349 | 0.723 |
| May | 2.370 |
1.278 | 0.362 | 0.717 |
| June | 2.441 | 1.211 | 0.271 | 0.776 |
| July | 2.302 | 1.220 | 0.331 | 0.729 |
| Aug | 2.118 | 1.207 | 0.385 | 0.681 |
| Sep | 1.613 | 1.169 | 0.563 | 0.518 |
| Oct | 1.546 | 1.223 | 0.666 | 0.456 |
| Nov | 1.174 | 1.209 | 0.839 | 0.306 |
| Dec | 0.003 | 1.275 | 1.275 | 0.000 |
| Year | 20.880 | 14.875 | 7.051 | 0.526 |
King Salmon has ample solar energy for domestic hot water. The performance for a 90° tilt collector follows. Note that a $5/gallon fuel oil backup cost is used for this and all other rural sites. While this is not accurate for all sites, it is the base for comparison that is used for all rural sites in Alaska. The price of fuel oil in rural Alaska is extremely unpredictable, so this was considered the best way to handle that uncertainty.
TABLE AC-26: King Salmon
90° tilt, Heliodyne 64 ft2, fuel oil at $5 per gallon
| Solar (106 Btu) | DHW (106 Btu) | Aux (106 Btu) | f Solar fraction | |
|---|---|---|---|---|
| Jan | 1.106 | 1.308 | 0.955 | 0.270 |
| Feb | 1.564 | 1.193 | 0.596 | 0.500 |
| Mar | 2.383 | 1.320 | 0.442 | 0.665 |
| Apr | 1.999 | 1.262 | 0.503 | 0.602 |
| May | 1.663 | 1.278 | 0.668 | 0.477 |
| June | 1.694 | 1.211 | 0.596 | 0.508 |
| July | 1.612 | 1.220 | 0.630 | 0.484 |
| Aug | 1.583 | 1.207 | 0.633 | 0.475 |
| Sep | 1.324 | 1.169 | 0.708 | 0.394 |
| Oct | 1.683 | 1.223 | 0.614 | 0.498 |
| Nov | 1.247 | 1.209 | 0.799 | 0.339 |
| Dec | 0.003 | 1.275 | 1.275 | 0.000 |
| 17.85914.8758.4190.434 |
The performance of the 90° tilt is significantly reduced from the 60° performance. As in Homer and other locations, the solution for this would be to make the collector area larger to compensate, which of course makes it more expensive.
TABLE AC-27: Kodiak
60°tilt, 64 ft2 Heliodyne, fuel oil backup at $5 per gallon
| Solar (106 Btu) | DHW (106 Btu) | Aux (106 Btu) | f Solar fraction | |
|---|---|---|---|---|
| Jan | 0.921 | 1.234 | 0.988 | 0.199 |
| Feb | 1.460 | 1.121 | 0.584 | 0.479 |
| Mar | 2.319 | 1.238 | 0.378 | 0.695 |
| Apr | 2.422 | 1.186 | 0.286 | 0.759 |
| May | 2.522 | 1.207 | 0.302 | 0.750 |
| June | 2.643 | 1.150 | 0.210 | 0.817 |
| July | 2.276 | 1.168 | 0.344 | 0.705 |
| Aug | 2.593 | 1.160 | 0.218 | 0.813 |
| Sep | 1.980 | 1.126 | 0.398 | 0.647 |
| Oct | 1.640 | 1.176 | 0.588 | 0.500 |
| Nov | 1.226 | 1.156 | 0.764 | 0.340 |
| Dec | 0.806 | 1.213 | 1.050 | 0.134 |
| Year | 22.809 | 14.134 | 6.109 | 0.568 |
Kodiak has fairly promising solar performance. Kodiak has snow, which is likely an annual weather variable. A 60° tilt might be worth the risk, but the next run shows how a 90° tilt collector might perform in Kodiak. The use of $5 as a back-up fuel cost (Kodiak is being considered rural Alaska) may be positively biasing this performance.
TABLE AC-28: Kodiak
90°tilt, 64 ft2 Heliodyne, fuel oil backup at $5 per gallon
| Solar (106 Btu) | DHW (106 Btu) | Aux (106 Btu) | f Solar fraction | |
|---|---|---|---|---|
| Jan | 0.981 | 1.234 | 0.951 | 0.229 |
| Feb | 1.491 | 1.121 | 0.572 | 0.489 |
| Mar | 2.238 | 1.238 | 0.425 | 0.657 |
| Apr | 1.875 | 1.186 | 0.519 | 0.562 |
| May | 1.755 | 1.207 | 0.613 | 0.492 |
| June | 1.809 | 1.150 | 0.542 | 0.528 |
| July | 1.585 | 1.168 | 0.639 | 0.453 |
| Aug | 1.926 | 1.160 | 0.484 | 0.583 |
| Sep | 1.627 | 1.126 | 0.554 | 0.508 |
| Oct | 1.517 | 1.176 | 0.644 | 0.452 |
| Nov | 1.296 | 1.156 | 0.727 | 0.371 |
| Dec | 0.870 | 1.213 | 1.009 | 0.168 |
| Year | 18.971 | 14.134 | 7.679 | 0.457 |
Things don’t look so good for the south wall option in Kodiak. The culprit here, in comparing to the 60° tilt option shown in the previous table, is the spring and summer performance, which is much worse for the vertical wall prediction. The result is a decline in annual performance of 18% from the 60° tilt theoretical option. This is one of the worst disparities in the entire set of Alaska locations and speaks to the high variability of the spring and summer climates in Alaska’s marine/coastal communities and the significant affect this weather has on solar performance. It also indicates that the data is often unique to a location and shouldn’t be widely presumed to fit another location, which is even close by, let alone more distant. Weather and cloud cover particularly, at the spring and summer seasons are crucial determinants of solar potential.
TABLE AC-29: Kotzebue
60° tilt, 64 ft2 Heliodyne, $5 per gallon backup fuel
| Solar (106 Btu) | DHW (106 Btu) | Aux (106 Btu) | f Solar fraction | |
|---|---|---|---|---|
| Jan | 1.023 | 1.425 | 1.110 | 0.221 |
| Feb | 1.556 | 1.303 | 0.683 | 0.476 |
| Mar | 2.867 | 1.447 | 0.325 | 0.775 |
| Apr | 3.478 | 1.391 | 0.072 | 0.948 |
| May | 3.328 | 1.417 | 0.080 | 0.943 |
| June | 2.926 | 1.347 | 0.124 | 0.908 |
| July | 2.855 | 1.360 | 0.118 | 0.913 |
| Aug | 2.096 | 1.342 | 0.410 | 0.695 |
| Sep | 1.618 | 1.294 | 0.596 | 0.539 |
| Oct | 1.796 | 1.347 | 0.615 | 0.543 |
| Nov | 0.999 | 1.324 | 1.018 | 0.231 |
| Dec | 0.574 | 1.391 | 1.370 | 0.015 |
| Year | 25.117 | 16.389 | 6.523 | 0.602 |
Kotzebue has one of the best clear sky climates in Alaska, and it shows. It also is on the coast and is known for its wind resource. This could mean that a 60° tilt would be quite good to use because regular wind events could clear snow off the collectors much as it does off roofs in the community. A 60% annual solar fraction speak well to solar applications in the NANA region of northwest Alaska, although more inland sites are not as windy and might do well to use a 90° tilt. That performance showing the result from a 90° tilt is show in the next table.
TABLE AC-30: Kotzebue
90° tilt, 64 ft2 Heliodyne, $5 per gallon backup fuel
| Solar (106 Btu) | DHW (106 Btu) | Aux (106 Btu) | f Solar fraction | |
|---|---|---|---|---|
| Jan | 1.166 | 1.425 | 1.018 | 0.285 |
| Feb | 1.682 | 1.303 | 0.619 | 0.525 |
| Mar | 2.892 | 1.447 | 0.328 | 0.773 |
| Apr | 3.039 | 1.391 | 0.231 | 0.834 |
| May | 2.513 | 1.417 | 0.386 | 0.727 |
| June | 2.116 | 1.347 | 0.461 | 0.658 |
| July | 2.132 | 1.360 | 0.429 | 0.685 |
| Aug | 1.638 | 1.342 | 0.623 | 0.536 |
| Sep | 1.414 | 1.294 | 0.700 | 0.459 |
| Oct | 1.901 | 1.347 | 0.566 | 0.579 |
| Nov | 1.123 | 1.324 | 0.941 | 0.289 |
| Dec | 0.663 | 1.391 | 1.305 | 0.062 |
| Year | 22.278 | 16.389 | 7.609 | 0.536 |
As expected, the 90°, south wall option for Kotzebue turns out to be a quite respectable 53.6% annual fraction, and is encouraging for solar applications in that region of Alaska, assuming that the equipment can be delivered for a reasonable cost.
TABLE AC-31: Mcgrath
90° tilt, 64 ft2 Heliodyne, $5 per gallon backup fuel
| Solar (106 Btu) | DHW (106 Btu) | Aux (106 Btu) | f Solar fraction | |
|---|---|---|---|---|
| Jan | 1.075 | 1.399 | 1.065 | 0.238 |
| Feb | 1.829 | 1.281 | 0.562 | 0.562 |
| Mar | 3.246 | 1.422 | 0.194 | 0.863 |
| Apr | 3.072 | 1.363 | 0.159 | 0.883 |
| May | 2.023 | 1.381 | 0.507 | 0.633 |
| June | 2.046 | 1.306 | 0.437 | 0.665 |
| July | 2.058 | 1.310 | 0.440 | 0.664 |
| Aug | 1.868 | 1.289 | 0.510 | 0.605 |
| Sep | 1.548 | 1.244 | 0.639 | 0.486 |
| Oct | 1.643 | 1.299 | 0.675 | 0.480 |
| Nov | 1.630 | 1.284 | 0.698 | 0.456 |
| Dec | -0.125 | 1.357 | 1.357 | 0.000 |
| Year | 21.914 | 15.936 | 7.245 | 0.545 |
Because the 90° tilt performance is sufficient for McGrath, it is the only run included in this manual. McGrath is an Interior Alaska location, with little wind and a long season of continuous snow cover. A south wall mounted solar collector seems the only system to recommend.
TABLE AC-32: Nome
60° tilt, 64 ft2 Heliodyne, $5 per gallon backup fuel
| Solar (106 Btu) | DHW (106 Btu) | Aux (106 Btu) | f Solar fraction | |
|---|---|---|---|---|
| Jan | 1.013 | 1.369 | 1.044 | 0.238 |
| Feb | 1.625 | 1.249 | 0.613 | 0.510 |
| Mar | 3.058 | 1.385 | 0.233 | 0.832 |
| Apr | 3.645 | 1.330 | 0.019 | 0.986 |
| May | 2.780 | 1.354 | 0.229 | 0.831 |
| June | 2.746 | 1.289 | 0.159 | 0.877 |
| July | 2.630 | 1.304 | 0.214 | 0.836 |
| Aug | 2.097 | 1.290 | 0.411 | 0.681 |
| Sep | 1.529 | 1.246 | 0.632 | 0.507 |
| Oct | 1.693 | 1.298 | 0.640 | 0.507 |
| Nov | 1.346 | 1.276 | 0.794 | 0.378 |
| Dec | 0.692 | 1.340 | 1.241 | 0.074 |
| Year | 24.856 | 15.730 | 6.228 | 0.604 |
Nome solar system performance is certainly ample for a 60°tilt and ,like Kotzebue, may be a fine choice since it has regular wind to clear the snow from a collector surface.
TABLE AC-33: Nome
90° tilt, 64 ft2 Heliodyne, $5 per gallon backup fue
| Solar (106 Btu) | DHW (106 Btu) | Aux (106 Btu) | f Solar fraction | |
|---|---|---|---|---|
| Jan | 1.136 | 1.369 | 0.967 | 0.294 |
| Feb | 1.652 | 1.249 | 0.593 | 0.526 |
| Mar | 3.050 | 1.385 | 0.249 | 0.820 |
| Apr | 3.419 | 1.330 | 0.109 | 0.918 |
| May | 2.038 | 1.354 | 0.528 | 0.610 |
| June | 1.990 | 1.289 | 0.488 | 0.621 |
| July | 1.931 | 1.304 | 0.512 | 0.608 |
| Aug | 1.619 | 1.290 | 0.634 | 0.508 |
| Sep | 1.307 | 1.246 | 0.747 | 0.401 |
| Oct | 1.763 | 1.298 | 0.608 x | 0.608 0.532 |
| Nov | 1.491 | 1.276 | 0.715 | 0.440 |
| Dec | 0.786 | 1.340 | 1.176 | 0.122 |
| Year | 22.182 | 15.730 | 7.326 | 0.534 |
Since the performance of the 90° tilt diminishes the solar fraction by 11.5% compared to the 60° tilt, taking a chance on the wind clearing the solar surfaces and tilting the collectors at 60° or at the steeper latitude tilt of 64° might be a good bet.
TABLE AC-32: Nome
60° tilt, 64 ft2 Heliodyne, $5 per gallon backup fuel
| Solar (106 Btu) | DHW (106 Btu) | Aux (106 Btu) | f Solar fraction | |
|---|---|---|---|---|
| Jan | 1.013 | 1.369 | 1.044 | 0.238 |
| Feb | 1.625 | 1.249 | 0.613 | 0.510 |
| Mar | 3.058 | 1.385 | 0.233 | 0.832 |
| Apr | 3.645 | 1.330 | 0.019 | 0.986 |
| May | 2.780 | 1.354 | 0.229 | 0.831 |
| June | 2.746 | 1.289 | 0.159 | 0.877 |
| July | 2.630 | 1.304 | 0.214 | 0.836 |
| Aug | 2.097 | 1.290 | 0.411 | 0.681 |
| Sep | 1.529 | 1.246 | 0.632 | 0.507 |
| Oct | 1.693 | 1.298 | 0.640 | 0.507 |
| Nov | 1.346 | 1.276 | 0.794 | 0.378 |
| Dec | 0.692 | 1.340 | 1.241 | 0.074 |
| Year | 24.856 | 15.730 | 6.228 | 0.604 |
Nome solar system performance is certainly ample for a 60°tilt and ,like Kotzebue, may be a fine choice since it has regular wind to clear the snow from a collector surface.
TABLE AC-33: Nome
90° tilt, 64 ft2 Heliodyne, $5 per gallon backup fue
| Solar (106 Btu) | DHW (106 Btu) | Aux (106 Btu) | f Solar fraction | |
|---|---|---|---|---|
| Jan | 1.136 | 1.369 | 0.967 | 0.294 |
| Feb | 1.652 | 1.249 | 0.593 | 0.526 |
| Mar | 3.050 | 1.385 | 0.249 | 0.820 |
| Apr | 3.419 | 1.330 | 0.109 | 0.918 |
| May | 2.038 | 1.354 | 0.528 | 0.610 |
| June | 1.990 | 1.289 | 0.488 | 0.621 |
| July | 1.931 | 1.304 | 0.512 | 0.608 |
| Aug | 1.619 | 1.290 | 0.634 | 0.508 |
| Sep | 1.307 | 1.246 | 0.747 | 0.401 |
| Oct | 1.763 | 1.298 | 0.608 | 0.532 |
| Nov | 1.491 | 1.276 | 0.715 | 0.440 |
| Dec | 0.786 | 1.340 | 1.176 | 0.122 |
| Year | 22.182 | 15.730 | 7.326 | 0.534 |
Since the performance of the 90° tilt diminishes the solar fraction by 11.5% compared to the 60° tilt, taking a chance on the wind clearing the solar surfaces and tilting the collectors at 60° or at the steeper latitude tilt of 64° might be a good bet.
TABLE AC-34: Palmer
60° tilt, 64 ft2 Heliodyne, $3 per gallon backup fuel oil
| Solar (106 Btu) | DHW (106 Btu) | Aux (106 Btu) | f Solar fraction | |
|---|---|---|---|---|
| Jan | 0.587 | 1.249 | 1.206 | 0.035 |
| Feb | 0.825 | 1.137 | 0.915 | 0.195 |
| Mar | 2.175 | 1.255 | 0.444 | 0.646 |
| Apr | 3.084 | 1.198 | 0.092 | 0.924 |
| May | 2.233 | 1.212 | 0.391 | 0.677 |
| June | 2.957 | 1.148 | 0.086 | 0.925 |
| July | 2.291 | 1.159 | 0.316 | 0.727 |
| Aug | 2.461 | 1.148 | 0.249 | 0.783 |
| Sep | 2.243 | 1.115 | 0.308 | 0.724 |
| Oct | 1.475 | 1.169 | 0.687 | 0.413 |
| Nov | 0.941 | 1.157 | 0.899 | 0.223 |
| Dec | 0.386 | 1.220 | 1.220 | 0.000 |
| Year | 21.660 | 14.166 | 6.812 | 0.519 |
At a 60° tilt, 64 ft2 of collector area yields just enough solar collection to qualify for the federal tax credit. It is likely though, since the Mat-Su Valley is transitional in climate between coastal and Interior, that snow cover will make the choice to go with south wall collection to avoid the snow obscuration. The next table shows that south wall performance for Palmer. Palmer also has natural gas available and a run comparing that option also follows.
ABLE AC-35: Palmer
90°tilt, 64 ft2 Heliodyne, $3 per gallon backup fuel oil
| Solar (106 Btu) | DHW (106 Btu) | Aux (106 Btu) | f Solar fraction | |
|---|---|---|---|---|
| Jan | 0.638 | 1.249 | 1.169 | 0.064 |
| Feb | 0.850 | 1.137 | 0.900 | 0.208 |
| Mar | 2.131 | 1.255 | 0.474 | 0.622 |
| Apr | 2.465 | 1.198 | 0.304 | 0.746 |
| May | 1.604 | 1.212 | 0.659 | 0.456 |
| June | 2.090 | 1.148 | 0.406 | 0.646 |
| July | 1.641 | 1.159 | 0.589 | 0.492 |
| Aug | 1.872 | 1.148 | 0.485 | 0.578 |
| Sep | 1.907 | 1.115 | 0.442 | 0.604 |
| Oct | 1.441 | 1.169 | 0.701 | 0.400 |
| Nov | 1.016 | 1.157 | 0.854 | 0.262 |
| Dec | 0.425 | 1.220 | 1.220 | 0.000 |
| Year | 18.082 | 14.166 | 8.204 | 0.421 |
The performance of a vertically mounted solar collector for the Palmer/Mat-Su is MUCH less than a 60° tilt option as shown in the previous table, so much so that it both doesn’t meet the federal tax credit minimum of 50% and performs about 18% worse than a theoretical 60° tilted collector array. The reason appears to be very diminished summer performance owing to cloudiness. This is similar to climates like Dillingham and to other transitional climates which have high summer cloudiness even though they are not high precipitation areas. A solution for this may be increasing the size of the collector, but that may be simplistic. Note also that the runs use a 40 gallon/day hot water demand, and that may be more than typical for Alaska. A lower hot water demand could possibly mean that a 64 ft2 collection area could be more adequate
TABLE AC-36: Palmer
90°tilt, 64 ft2 Heliodyne, $1 per therm natural gas backup
| Solar (106 Btu) | DHW (106 Btu) | Aux (106 Btu) | f Solar fraction | |
|---|---|---|---|---|
| Jan | 0.638 | 1.249 | 1.169 | 0.064 |
| Feb | 0.850 | 1.137 | 0.900 | 0.208 |
| Mar | 2.131 | 1.255 | 0.474 | 0.622 |
| Apr | 2.465 | 1.198 | 0.304 | 0.746 |
| May | 1.604 | 1.212 | 0.659 | 0.456 |
| June | 2.090 | 1.148 | 0.406 | 0.646 |
| July | 1.641 | 1.159 | 0.589 | 0.492 |
| Aug | 1.872 | 1.148 | 0.485 | 0.578 |
| Sep | 1.907 | 1.115 | 0.442 | 0.604 |
| Oct | 1.441 | 1.169 | 0.701 | 0.400 |
| Nov | 1.016 | 1.157 | 0.854 | 0.262 |
| Dec | 0.425 | 1.220 | 1.220 | 0.000 |
| Year | 18.082 | 14.166 | 8.204 | 0.421 |
The run for Palmer using natural gas as a backup fuel is identical to the run at 90° using fuel oil as a backup because the crucial parameters, collector size and tilt, are the same. The economic value of the solar option is less in this natural gas case because of the even less expensive fuel, so natural gas is still very hard to compete with if the economic argument is still the dominant one. This appears to be the case for all areas where natural gas is available. The price for natural gas from Enstar, provider for most of southcentral Alaska was $.98 per therm (100,000 Btu) at the time of this publication.
TABLE AC-37: Sitka
60° tilt, 64 ft2 Heliodyne, $3 backup fuel oil
| Solar (106 Btu) | DHW (106 Btu) | Aux (106 Btu) | f Solar fraction | |
|---|---|---|---|---|
| Jan | 0.955 | 1.221 | 0.959 0.215 | 0.959 0.215 |
| Feb | 1.397 | 1.109 | 0.618 | 0.442 |
| Mar | 2.293 | 1.225 | 0.375 | 0.694 |
| Apr | 3.268 | 1.172 | 0.056 | 0.952 |
| May | 2.361 | 1.192 | 0.343 | 0.712 |
| June | 2.354 | 1.135 | 0.290 | 0.744 |
| July | 2.314 | 1.153 | 0.328 | 0.715 |
| Aug | 2.502 | 1.146 | 0.246 | 0.785 |
| Sep | 1.906 | 1.112 | 0.413 | 0.628 |
| Oct | 1.376 | 1.162 | 0.693 | 0.404 |
| Nov | 1.250 | 1.144 | 0.729 | 0.363 |
| Dec | 0.832 | 1.200 | 1.028 | 0.144 |
| Year | 22.807 | 13.971 | 6.079 | 0.565 |
The solar performance looks very promising, and surprisingly so. It may be worthwhile to use a 60° tilt as snow is intermittent in Sitka, more so than other Southeast climates.
TABLE AC-38: Talkeetna
90° tilt, 64 ft2 Heliodyne, $3 per gallon fuel oi
| Solar (106 Btu) | DHW (106 Btu) | Aux (106 Btu) | f Solar fraction | |
|---|---|---|---|---|
| Jan | 1.232 | 1.319 | 0.892 | 0.324 |
| Feb | 2.017 | 1.205 | 0.433 | 0.641 |
| Mar | 3.032 | 1.333 | 0.198 | 0.851 |
| Apr | 2.855 | 1.273 | 0.202 | 0.842 |
| May | 2.019 | 1.286 | 0.492 | 0.617 |
| June | 2.018 | 1.215 | 0.438 | 0.640 |
| July | 1.91 | 8 1.220 | 0.486 | 0.601 |
| Aug | 1.763 | 1.204 | 0.546 | 0.547 |
| Sep | 1.760 | 1.166 | 0.510 | 0.562 |
| Oct | 1.686 | 1.222 | 0.604 | 0.506 |
| Nov | 1.587 | 1.212 | 0.651 | 0.462 |
| Dec | 0.097 | 1.282 | 1.282 | 0.000 |
| Year | 21.791 | 14.938 | 6.734 | 0.549 |
Since Talkeetna is a snow-prone climate, only the 90° tilt run is made. It predicts a quite ample amount of solar water heating and will likely be a great advantage in a climate where regular snow would cover a collector of any other, particularly a latitude tilt angle (~61°.).
TABLE AC-42: Fairbanks Airport Data, Evacuated Tube Hot Water System
90° south mount, 66 ft2
| Solar (106 Btu) | DHW (106 Btu) | Aux (106 Btu) | f Solar fraction | |
|---|---|---|---|---|
| Jan | 1.166 | 1.384 | 0.917 | 0.338 |
| Feb | 1.664 | 1.270 | 0.576 | 0.546 |
| Mar | 3.119 | 1.409 | 0.212 | 0.850 |
| Apr | 3.012 | 1.347 | 0.182 | 0.865 |
| May | 2.564 | 1.358 | 0.322 | 0.763 |
| June | 2.328 | 1.278 | 0.345 | 0.730 |
| July | 2.307 | 1.275 | 0.354 | 0.722 |
| Aug | 2.284 | 1.252 | 0.353 | 0.718 |
| Sep | 1.817 | 1.209 | 0.474 | 0.608 |
| Oct | 1.826 | 1.267 | 0.527 | 0.584 |
| Nov | 1.175 | 1.259 | 0.816 | 0.352 |
| Dec | 0.544 | 1.337 | 1.210 | 0.095 |
| Year | 23.807 | 15.645 | 6.289 | 0.598 |
Comparative Notes: This result is for Fairbanks with a 66 ft2 evacuated tube system, and is quite respectable. It clearly meets the specification for the solar tax credit. Costs for such a system are not clear at this time. Also, a 90° (vertical) mount is crucial for these systems, as recommended by both Tom Lane in his “Solar Hot Water Systems Lessons Learned 1997” to Today classic manual and Jake Tornatsky, a California solar installer who has taught an installer class in Fairbanks. This is because the evacuated tubes are so efficiently insulated by the vacuum in the tubes, that snow will NOT melt off them! Keep this in mind if you choose evacuated tube collectors for your system!
TABLE AC-43: Homer Airport Data, Evacuated Tube Hot Water System
90° south mount, 66 ft2
1.180
| Solar (106 Btu) | DHW (106 Btu) | Aux (106 Btu) | f Solar fraction | |
|---|---|---|---|---|
| Jan | 0.738 | 1.273 | 1.014 | 0.203 |
| Feb | 1.409 | 1.159 | 0.586 | 0.494 |
| Mar td> | 2.224 </ | 1.281 | 0.410 | 0.680 |
| Apr | 1.638 | 1.225 | 0.582 | 0.525 |
| May | 1.757 | 1.242 | 0.561 | 0.549 |
| June | 1.975 | 1.179 | 0.437 | 0.629 |
| July | 1.700 | 1.191 | 0.543 | 0.544 |
| Aug | 2.085 | 0.397 | 0.664 | |
| Sep | 1.368 | 1.144 | 0.609 | 0.468 |
| Oct | 1.550 | 1.198 | 0.574 | 0.521 |
| Nov | 1.546 | 1.182 | 0.562 | 0.525 |
| Dec | 0.595 | 1.245 | 1.075 | 0.137 |
| Year | 18.584 | 14.499 | 7.350 | 0.493 |
Comparative Notes: Again as in Anchorage and Fairbanks, the Homer simulation is comparable to an equivalent sized flat plate collector array in performance. And as in those flat plate examples, Homer is just below the qualifying 50% annual fraction for the federal tax credit. Summer overheating will also be an issue, as in the flat plate systems.
TABLE AC-44: Kodiak Airport Data, Evacuated Tube Hot Water System
90° south mount, 66 ft2
| Solar (106 Btu) | DHW (106 Btu) | Aux (106 Btu) | f Solar fraction | |
|---|---|---|---|---|
| Jan | 0.914 | 1.234 | 0.886 | 0.282 |
| Feb | 1.332 | 1.121 | 0.581 | 0.481 |
| Mar | 1.861 | 1.238 | 0.508 | 0.590 |
| Apr | 1.932 | 1.186 | 0.451 | 0.620 |
| May | 1.808 | 1.207 | 0.532 |
0.559 |
| June | 1.864 | 1.150 | 0.466 | 0.595 |
| July | 1.633 | 1.168 | 0.559 | 0.521 |
| Aug | 1.984 | 1.160 | 0.423 | 0.635 |
| Sep | 1.675 | 1.126 | 0.480 | 0.574 |
| Oct | 1.559 | 1.176 | 0.559 | 0.525 |
| Nov | 1.204 | 1.156 | 0.685 | 0.408 |
| Dec | 0.820 | 1.213 | 0.920 | 0.241 |
| Year | 18.586 | 14.134 | 7.050 | 0.501 |
Comparative Notes: The Kodiak result for evacuated tube collection is quite respectable and is more than that of Homer, qualifying for the federal tax credit.
TABLE AC-45: Palmer Data, Evacuated Tube Hot Water System
90° south mount, 66 ft2
| Solar (106 Btu) | DHW (106 Btu) | Aux (106 Btu) | f Solar fraction | |
|---|---|---|---|---|
| Jan | 0.614 | 1.249 | 1.055 | 0.155 |
| Feb | 0.761 | 1.137 | 0.854 | 0.248 |
| Mar | 1.814 | 1.255 | 0.538 | 0.571 |
| Apr | 2.542 | 1.198 | 0.251 | 0.791 |
| May | 1.654 | 1.212 | 0.581 | 0.521 |
| June | 2.156 | 1.148 | 0.349 | 0.696 |
| July | 1.693 | 1.159 | 0.517 | 0.554 |
| Aug | 1.930 | 1.148 | 0.424 | 0.631 |
| Sep | 1.966 | 1.115 | 0.366 | 0.671 |
| Oct | 1.416 | 1.169 | 0.625 | 0.466 |
| Nov | 0.973 | 1.157 | 0.782 | 0.324 |
| Dec | 0.413 | 1.220 | 1.149 | 0.059 |
| Year | 17.933 | 14.166 | 7.491 | 0.471 |
TABLE AC-46: Palmer Data, Evacuated Tube Hot Water System
60° south mount (test for comparison), 66 ft2
| Solar (106 Btu) | DHW (106 Btu) | Aux (106 Btu) | f Solar fraction | |
|---|---|---|---|---|
| Jan | 0.583 | 1.249 | 1.073 | 0.141 |
| Feb | 0.793 | 1.137 | 0.841 | 0.260 |
| Mar | 2.051 | 1.255 | 0.447 | 0.644 |
| Apr | 3.180 | 1.198 | 0.045 | 0.962 |
| May | 2.303 | 1.212 | 0.338 | 0.721 |
| June | 3.049 | 1.148 | 0.049 | 0.957 |
| July | 2.363 | 1.159 | 0.268 | 0.768 |
| Aug | 2.538 | 1.148 | 0.199 | 0.827 |
| Sep | 2.313 | 1.115 | 0.249 | 0.777 |
| Oct | 1.486 | 1.169 | 0.598 | 0.489 |
Nov |
0.933 | 1.157 | 0.305 | |
| Dec | 0.386 | 1.220 | 1.165 | 0.045 |
| Year | 21.979 | 14.166 | 6.076 | 0.571 |
Comparative Notes: As may be expected, a 60° tilt of the evacuated tubes does give a better theoretical result, but as noted previously, it is subject to serious snow accumulation issues. If mounted on the ground for easy clearing, a 60° tilt would provide 14% more solar gain than a 90° tilt, but only if snow is kept off it!
TABLE AC-47: Talkeetna Data, Evacuated Tube Hot Water System
90° south mount, 66 ft2
| Solar (106 Btu) | DHW (106 Btu) | Aux (106 Btu) | f Solar fraction | |
|---|---|---|---|---|
| Jan | 1.221 | 1.319 | 0.818 | 0.380 |
| Feb | 1.900 | 1.205 | 0.433 | 0.640 |
| Mar | 2.649 | 1.333 | 0.294 | 0.779 |
| Apr | 2.684 | 1.273 | 0.247 | 0.806 |
| May | 2.083 | 1.286 | 0.459 | 0.643 |
| June | 2.081 | 1.215 | 0.405 | 0.666 |
| July | 1.979 | 1.220 | 0.447 | 0.634 |
| Aug | 1.819 | 1.204 | 0.497 | 0.587 |
| Sep | 1.816 | 1.166 | 0.447 | 0.617 |
| Oct | 1.667 | 1.222 | 0.552 | 0.548 |
| Nov | 1.555 | 1.212 | 0.589 | 0.514 |
| Dec |
-0.100 | 1.282 | 1.282 | 0.000 |
| Year | 21.354 | 14.938 | 6.471 | 0.567 |
Comparative Notes: For our final run, we look at the performance of an evacuated tube system mounted vertically in Talkeetna. It looks quite promising and avoids the snow problem.
Appendix E: Glossary
absorbant—the less volatile of the two working fluids in an absorption cooling device.
absorber—the surface in a collector that absorbs solar radiation and converts it to heat energy; generally a matte-black metallic surface is best.
absorption chiller—air conditioning device that uses heat at 190°F or higher to generate cooling; it may be powered by solar-heated water.
absorptivity—the ratio of the energy absorbed by a surface to the energy absorbed by a black body at the same temperature.
active solar energy systems—in contrast to passive solar energy approaches, an active solar energy system uses outside energy to operate the system, to transfer the collected solar energy from the collector to storage, and to distribute it throughout the living unit. Active systems can provide space heating and cooling and domestic hot water.
airlock entry—a vestibule enclosed with two air-tight doors; it reduces heat loss by limiting the movement of heated air.
air-type collector—a collector that uses air for heat transfer.
altitude—the angular distance from the horizon to the sun.
ambient temperature—the natural temperature surrounding an object; it usually refers to outdoor temperature.
atrium—a closed interior court to which other rooms open; it is often used for passive solar collection.
auxiliary energy—auxiliary heat plus the energy required to operate pumps, blowers, or other devices.
auxiliary heat—the heat provided by a conventional heating system for periods of cloudiness or intense cold, when a solar heating system cannot provide enough heat.
azimuth—the angular distance from true south to the point on the horizon directly below the sun.
backup energy system—a backup energy system using conventional fuels should be provided for heating and domestic hot water. This system should be capable of providing all of the energy demand during any period when the solar energy system is not operating. Components and subsystems may be used as parts of both systems where the component or sub-system is a recognized, acceptable product in the conventional building industry.
berm—see earth berm.
British thermal unit (BTU)—a unit of heat energy; the quantity needed to raise the temperature of one pound of water one degree Fahrenheit.
building envelope—the elements (walls, roof, floors) of a building that enclose conditioned spaces.
calorie—amount of heat required to raise one gram of water one degree centigrade.
clerestory—a window located high in a wall near the eaves, used for light, heat gain, and ventilation.
coefficient of heat transmission—the rate of heat transmission measured per degree of temperature difference per hour, through a square foot of wall or other building surface. It is usually called the U-value.
collection—the process of trapping solar radiation and converting it to heat. collector—a device that collects solar radiation and converts it to heat.
collector aperture—the glazed opening in a collector that admits solar radiation.
collector efficiency—the ratio of the heat energy extracted from a collector to the solar energy striking it.
collector tilt—the angle between the horizontal plane and the solar collector plane, designed to maximize the collection of solar radiation.
comfort zone—the range of temperature and humidity in which most people feel comfortable.
concentrating collector—a collector with a lens or a reflector that concentrates the sun’s rays on a relatively small absorber surface.
conduction—the flow of heat between a hotter material and a colder material that are in direct physical contact.
conductivity—the property of a material indicating the quantity of heat that will flow through one foot of a material for each degree of temperature difference.
convection, forced—commonly, the transfer of heat by the forced flow of air or water.
convection, natural—the motion of a gas or liquid, caused by temperature or density difference, by which heat is transported.
cooling pond—a large body of water that loses heat from its surface, largely by evaporation but also by convection and radiation.
cooling tower—a device for cooling water by evaporation.
cover plate—a layer of glass or transparent plastic placed above the absorber plate in a flat-plate collector to reduce heat losses.
damper—a control that permits, prevents, or controls the passage of air through a duct.
degree day—a unit of measurement for outside temperature; it is the difference between a fixed temperature (usually 65°F [18°C]) and the average temperature for the day.
design heating load—the total heat loss from a building under the most severe winter conditions likely to occur.
design outside temperature—the lowest outdoor temperature expected during a heating season. diffuse radiation—indirect scattered sunlight that casts no shadow.
direct radiation—sunlight that casts shadows, also called beam radiation.
direct solar gain—a type of passive solar heating system in which solar radiation passes through the south-facing living space before being stored in the thermal mass for long-term heating.
distribution—the movement of collected heat to the living areas from collectors or storage.
diurnal temperature range—the variation in outdoor temperature between day and night.
double-glazed—covered by two layers of glazing material (commonly glass or plastic).
double-walled heat exchanger—a heat exchanger that separates the collector fluid from the potable water by two surfaces; it is required if the collector fluid is not potable.
drainback—a type of liquid heating system that is designed to drain into a tank when the pump is off.
earth berm—a mound of dirt that abuts a building wall to stabilize interior temperature or to deflect the wind.
emissivity—the ratio of the energy radiated by a body to the energy radiated by a black body at the same temperature.
energy audit—an accounting of the forms of energy used during a designated period, such as monthly.
eutectic salts—a mixture of two or more pure materials that melts at a constant temperature; a material that stores large amounts of latent heat.
evaporative cooling—a method of space conditioning that requires the addition of bodies of water or of moisture for cooling the living spaces.
fan coil—a unit consisting of a fan and a heat exchanger that transfers heat from liquid to air (or vice versa); usually located in a duct.
flat-plate collector—a solar collection device in which sunlight is converted to heat on a flat surface; air or liquid flows through the collector to remove the heat.
flywheel effect—the damping of interior temperature fluctuations by massive construction. (See diurnal temperature range.)
forced-air heat—a conventional heating distribution system that uses a blower to circulate heated air.
galvanic corrosion—the deterioration of tanks, pipes, or pumps that occurs when a conducting liquid permits electrical contact between two different metals, causing the more active metal to corrode.
Glauber’s salts—a term for sodium sulfate decahydrate, which melts at 90°F; a component of eutectic salts.
glazing—a material that is translucent or transparent to solar radiation.
greenhouse—in passive solar design, an attached glazed area from which heat is withdrawn to the living space during the day.
heat capacity (specific heat)—the quantity of heat required to raise the temperature of a given mass of a substance 1°F.
heat exchanger—a device that transfers heat from one fluid to another.
heat gain—as applied to heating or cooling load, that amount of heat gained by a space from all sources (including people, lights, machines, sunshine, etc.).
heat pump—an electrically operated machine for heating and cooling; when heating, it transfers heat from one medium at a lower temperature (called the heat source) to a medium at a higher temperature (called the heat sink), thereby cooling the source (outside air) and warming the sink (the house); when cooling, the heat pump functions much like an air conditioner— taking unwanted heat from the heat source (a building) and dumping it to the heat sink (the outside).
heat sink—a medium (water, earth, or air) capable of accepting heat.
heat source—a medium (water, earth, or air) from which heat is extracted.
heat transfer—conduction, convection, or radiation (or a combination of these).
heating load—the rate of heat flow required to maintain indoor comfort; measured in BTU per hour.
heating season—the period from early fall to late spring during which heat is needed to keep a house comfortable.
heliostat—an instrument consisting of a mirror mounted on an axis moved by clockwork; the heliostat reflects sunbeams in one direction, usually to a central absorber located in a tower.
hybrid solar energy system—a hybrid system is one incorporating a major passive aspect, where at least one of the significant thermal energy flows is by natural means and at least one is by forced means.
hydronic system—a conventional heating system that circulates hot water, usually 160°F to 180°F, through baseboard finned pipes or radiators.
indirect gain solar—a type of passive solar heating system in which the storage is interposed between the collecting and the distributing surfaces (e.g., Trombe wall, water wall, or roof pond).
infiltration—the uncontrolled movement of outdoor air into a building through leaks, cracks, windows, and doors.
infrared radiation—the invisible rays just beyond the red of the visible spectrum; their wavelengths are longer than those of the spectrum colors (.7 to 400 microns), and they have a penetrating heating effect.
insolation—the amount of solar radiation (direct, diffuse, or reflected) striking a surface exposed to the sky; measured in BTU per square foot per hour (or in watts per square meter).
insulation—a material that increases resistance to heat flow.
isolated solar gain—a type of passive solar heating system in which heat is collected in one area to be used in another (e.g., greenhouse or attic collector).
kilowatt—a measure of power or heat flow rate; it equals 3,413 BTU per hour.
kilowatt-hour (kwh)—the amount of energy equivalent to one kilowatt of power being used for one hour; 3,413 BTU.
langley—a measure of solar radiation; it equals one calorie per square centimeter, or 3.69 BTU per square foot.
latent heat—the change in heat content that occurs with a change in phase and without change in temperature; the heat stored in the material during melting or vaporization. Latent heat is recovered by freezing a liquid or by condensing a gas.
life-cycle cost analysis—the accounting of capital, interest, and operating costs over the useful life of the solar system compared to those costs without the solar system.
liquid-type collector—a collector that uses a liquid as the heat transfer fluid.
microclimate—the variation in regional climate at a specific site; caused by topography, vegetation, soil, water conditions, and construction.
movable insulation—a device that reduces heat loss at night or during cloudy periods and permits heat gain in sunny periods (e.g., Beadwall®, insulated draperies, automatic shutters); it may also be used to reduce heat gains in summer.
nocturnal cooling—cooling through radiation of heat from warm surfaces to a night sky.
nonpotable—water that is not suitable for drinking or cooking purposes.
nonrenewable energy source—a mineral energy source that is in limited supply, such as fossil (gas, oil, and coal) and nuclear fuels.
passive solar energy systems and concepts—passive solar heating applications generally involve energy collection through south-facing glazed areas; energy storage in the building mass or in special storage elements; energy distribution by natural means such as convection, conduction, or radiation with only minimal use of low-power fans or pumps; and a method controlling both high and low temperatures and energy flows. Passive cooling applications usually include methods of shading collector areas from exposure to the summer sun and provisions to induce ventilation to reduce internal temperatures and humidity.
payback—the time needed to recover the investment in a solar energy system.
peak load—the maximum instantaneous demand for electrical power, which determines the generating capacity required by a public utility.
percent possible sunshine—the amount of radiation available compared to the amount that would be present if there were no cloud cover; usually measured on a monthly basis.
phase-change—see latent heat.
photovoltaic cell—a device without any moving parts that converts light directly into electricity by the excitement of electrons.
potable—water that is suitable for drinking or cooking purposes.
preheat—the use of solar energy to partially heat a substance, such as domestic potable water, prior to heating it to a higher desired temperature with auxiliary fuel.
prompt wall—a thin, low-mass wall similar to a Trombe wall, but designed to respond more rapidly to solar gain.
pyranometer—an instrument for measuring direct and diffuse solar radiation.
pyrheliometer—an instrument that measures the intensity of the direct radiation from the sun; the diffuse component is not measured.
radiation—the process by which energy flows from one body to another when the bodies are separated by a space, even when a vacuum exists between them.
refrigerant—fluid, such as Freon®, that is used in heating or cooling devices, such as heat pumps, air conditioners, or solar collectors.
renewable energy source—solar energy and certain forms derived from it, such as wind, biomass, and hydro.
reradiation—the emission of previously absorbed radiation.
retrofit—to modify an existing building by adding a solar heating system or insulation.
rock bin or rock bed—a heat storage container filled with rocks or pebbles, used in air-type solar heating/cooling systems.
R-value—see thermal resistance.
seasonal efficiency—the ratio of the solar energy collected and used to the solar energy striking the collector, measured over an entire heating season.
selective surface—a surface that is a good absorber of sunlight but a poor emitter of thermal radiation, used as a coating for absorbers to increase collector efficiency.
sensible heat—heat which, when gained or lost, results in a change in temperature.
shading coefficient—the ratio of the amount of sunlight transmitted through a window under specific conditions to the amount of sunlight transmitted through a single layer of common window glass under the same conditions.
solar access or solar rights—the ability to receive direct sunlight that has passed over land located to the south; the protection of solar access is a legal issue.
solar cell—see photovoltaic cell.
solar collector—a device that collects solar radiation and converts it to heat.
solar constant—the average intensity of solar radiation reaching the earth outside the atmosphere; 429.2 BTU per square foot per hour (or 1,354 watts per square meter).
solar fraction—the percentage of a building’s seasonal heating requirement provided by a solar system.
solar furnace—a solar concentrator used to produce very high temperatures; also a trade name for a modular air heating system, usually ground mounted, with rock storage.
solar gain—the part of a building’s heating or an additional cooling load that is provided by solar radiation striking the building or passing into the building through windows.
solar noon—the time of day when the sun is due south; halfway between sunrise and sunset.
solar radiation—energy radiated from the sun in the electromagnetic spectrum; visible light and infrared light are used by solar energy systems.
solar thermal electric power—the indirect conversion of solar energy into electricity by solar collectors, a heat engine, and electrical generators.
solarium—a living space enclosed by glazing; a greenhouse.
specific heat capacity—the quantity of heat needed to change the temperature of one pound of a material by one degree Fahrenheit (or one kilogram of a material by one degree centigrade).
stack effect—the rising of heated air over a dark surface by natural convection to create a draft, used to provide summer ventilation in some passive houses.
stagnation—a high-temperature condition obtained in a solar collector when the sun is shining and no fluid is flowing through the collector; temperatures range from 250°F to 400°F, depending on collector design. Any condition under which a collector is losing as much heat as it gains.
storage—the device or medium that absorbs collected solar heat and stores it for later use.
storage capacity—the quantity of heat that can be contained in a storage device.
sunspace—a living space enclosed by glazing; a solarium or greenhouse.
sun tempering—a method that involves a significant daytime solar gain and an effective distribution system but generally lacks a storage system.
therm—a quantity of heat equal to 100,000 Btu; approximately 100 cubic feet of natural gas.
thermal lag—in an indirect gain system, the time delay for heat to move from the outer collecting surface to the inner radiating surface.
thermal mass—the heat capacity of a building material (brick, concrete, adobe, or water containers).
thermal radiation—see infrared radiation.
thermal resistance (R-value)—the tendency of a material to retard the flow of heat; the reciprocal of the coefficient of heat trans-mission.
thermosiphoning—heat transfer through a fluid (such as air or liquid) by currents resulting from the natural fall of heavier, cool fluid and rise of lighter, warm fluid.
tilt angle—see collector tilt.
tracking—for a collector, a device that causes the panel to follow the sun.
transfer medium—the substance that carries heat from the solar collector to storage or from storage to the living areas.
trickle-type collector—a collector in which the heat transfer fluid flows in open channels on the absorber.
Trombe wall—masonry, typically 8 to 16 inches thick, blackened and exposed to the sun behind glazing; a passive solar heating system in which a masonry wall collects, stores, and distributes heat.
tromped wall—a fanciful name for a hybrid low-mass wall that is useful as a convector of solar heating. It is similar in effect to a prompt wall yet it has more mass and is conceptually similar to a Trombe wall, so the term “tromped” wall (Trombe + prompt = tromped) was coined.
U-value—see coefficient of heat transmission.
vapor barrier—a waterproof liner used to prevent passage of moisture through the building structure. Vapor barriers in walls and ceilings should be located on the heated side of the building.
wet-bulb temperature—the lowest temperature attainable by evaporating water in the air; a measure of humidity.
zoned heating—the control of the temperature in a room or a group of rooms independently of other rooms.