

Slide show: Market opportunities for shellfish aquaculture


Transcript of slides
Slide 1
Market Opportunities For Shellfish Aquaculture
Shellfish Aquaculture Conference
Anchorage, Alaska
December 3, 2004
Howard M. Johnson
H.M. Johnson & Associates
Slide 2
Howard M. Johnson
Howard@hmj.com
www.hmj.com
www.fishjobs.com
30+ years in the seafood industry
15+ years in seafood consulting and market research
Slide 3
Shellfish Marketing Agenda Shellfish Marketing Agenda
The view from 30,000 feet
- World seafood supply demand trends
- Forecast world demand
- Japan
- China
- Europe
- United States
- World cultured shellfish production
- U.S. shellfish culture issues/opportunities
- Marketing opportunities for Alaska
Slide 4
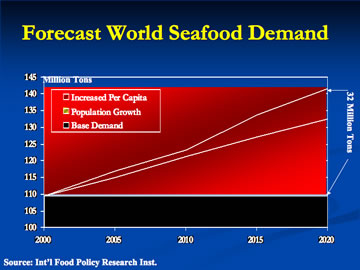
Forecast World Seafood Demand
Graph image: Showing how the demand will increase from 2000 - 2022 of seafood. Source: Int’l Food Policy Research Inst.
Slide 5
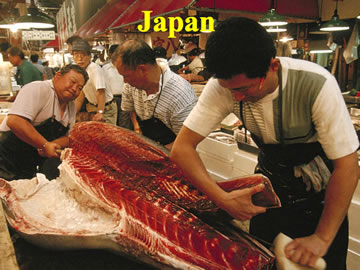
Japan
Image: Showing Japan seafood
Slide 6
Japanese Seafood Supply
Trending Lower
Graph image: Showing the decrease of supply from Japan from 1994 - 2003 in imports, aquaculture, and fisheries.
Slide 7
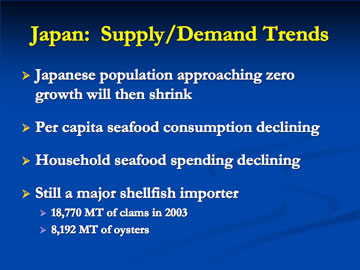
Japan: Supply/Demand Trends
- Japanese population approaching zero growth will then shrink
- Per capita seafood consumption declining
- Household seafood spending declining
- Still a major shellfish importer
- 18,770 MT of clams in 2003
- 8,192 MT of oysters
Slide 8
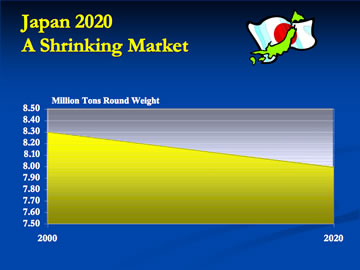
Japan 2020 A Shrinking Market
Graph image: Showing how the market will decline from 2000 - 2020
Slide 9
China
Image: Showing China scenic
Slide 10
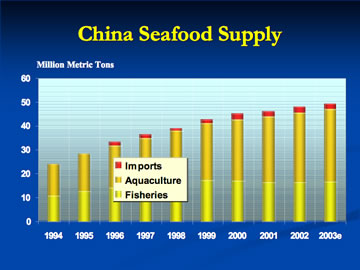
China Seafood Supply
Graph image: Showing the increase of supply from China from 1994 - 2003 in imports, aquaculture, and fisheries.
Slide 11
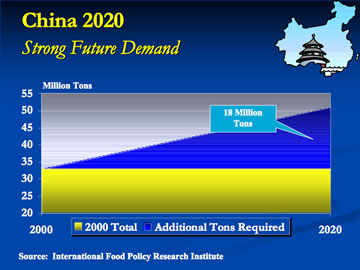
China 2020
Strong Future Demand
Graph image: Showing how the demand will increase from 2000 - 2020. Source: International Food Policy Research Institute
Slide 12
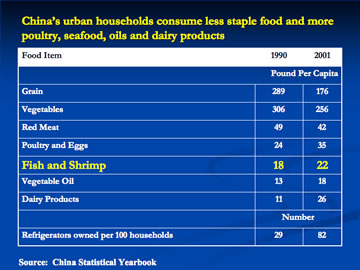
China’s urban households consume less staple food and more poultry, seafood, oils and dairy products
| Food Item | 1990 | 2001 |
|---|---|---|
| Pound Per Capita | ||
| Grain | 289 | 176 |
| Vegetables | 306 | 256 |
| Red Meat | 49 | 42 |
| Poultry and Eggs | 24 | 35 |
| Fish and Shrimp | 18 | 22 |
| Vegetable Oil | 13 | 18 |
| Dairy Products | 11 | 26 |
| Number | ||
| Refrigerators owned per 100 households | 29 | 82 |
Source: China Statistical Yearbook
Slide 13
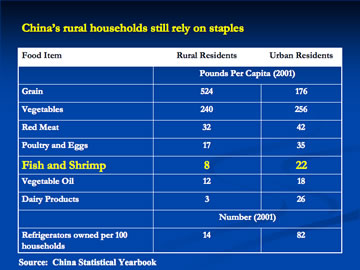
China’s rural households still rely on staples
| Food Item | Rural Residents | Urban Residents |
|---|---|---|
| Pounds Per Capita (2001) | ||
| Grain | 524 | 176 |
| Vegetables | 240 | 256 |
| Red Meat | 32 | 42 |
| Poultry and Eggs | 17 | 35 |
| Fish and Shrimp | 8 | 22 |
| Vegetable Oil | 12 | 18 |
| Dairy Products | 3 | 26 |
| Number | ||
| Refrigerators owned per 100 households | 14 | 82 |
Source: China Statistical Yearbook
Slide 14
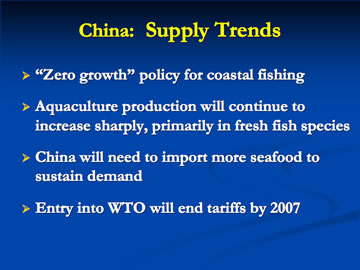
China: Supply Trends
- “Zero growth” policy for coastal fishing
- Aquaculture production will continue to increase sharply, primarily in fresh fish species
- China will need to import more seafood to sustain demand
- Entry into WTO will end tariffs by 2007
Slide 15
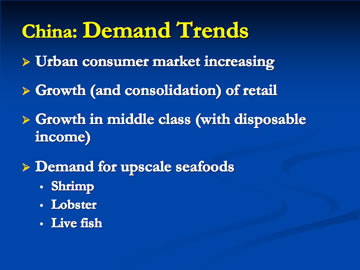
China: Demand Trends
- Urban consumer market increasing
- Growth (and consolidation) of retail
- Growth in middle class (with disposable income)
- Demand for upscale seafoods
- Shrimp
- Lobster
- Live fish
Slide 16
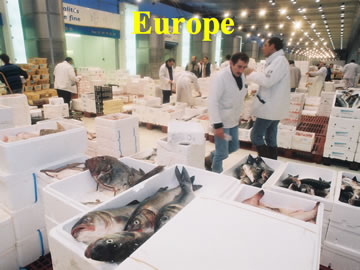
Europe
Image: Showing an european fish market
Slide 17
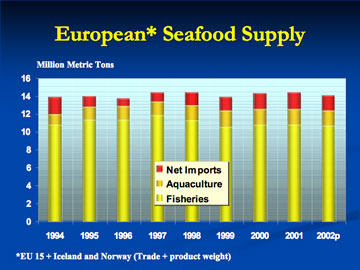
European* Seafood Supply
Graph image: Showing the trends of imports, aquaculture and fisheries for 1994 - 2002. Source: *EU 15 + Iceland and Norway (Trade + product weight)
Slide 18
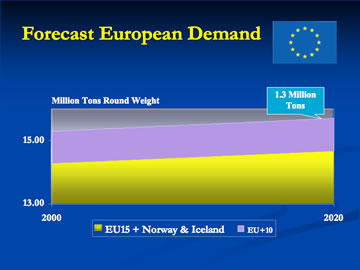
Forecast European Demand
Graph image: Showing the increase of demand from 2000 - 2020
Slide 19
World Shellfish Culture
Image: Arctic ocean winter scenic
Slide 20
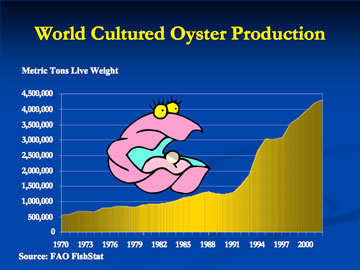
World Cultured Oyster Production
Graph image: Showing the predicted oyster production increase from 1970 to 2000. Source: FAO FishStat.
Slide 21
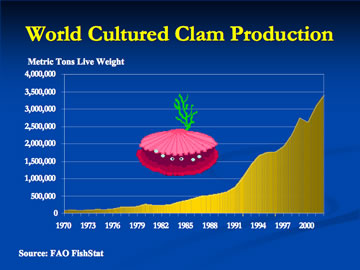
World Cultured Clam Production
Graph image: Showing the predicted clam production increase from 1970 to 2000. Source: FAO FishStat.
Slide 22
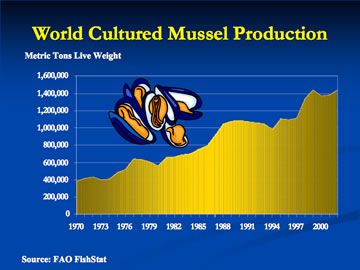
World Cultured Mussel Production
Graph image: Showing the predicted mussel production increase from 1970 to 2000. Source: FAO FishStat.
Slide 23
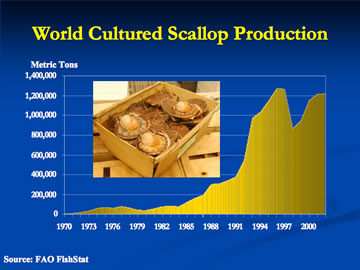
World Cultured Scallop Production
Graph image: Showing the predicted scallop production increase from 1970 to 2000. Source: FAO FishStat.
Slide 24
U.S. Shellfish Market
Image: Water scenic
Slide 25
U.S. Cultured Shellfish Production
Graph image: Showing the predicted oysters, blue mussels, and scallops production increase from 1990 to 2002 in the U.S.. Source: FAO..
Slide 26
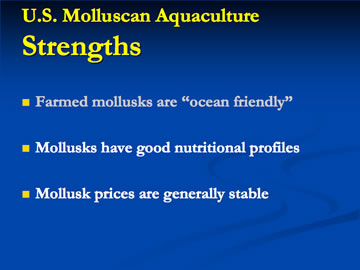
U.S. Molluscan Aquaculture
Strengths
- Farmed mollusks are “ocean friendly”
Slide 27
Farmed Mollusks Rate High with Environmental Groups
- Blue Ocean Institute – “Farmed clams, mussels, oysters and bay scallops…top choice.”
- Monterey Bay Aquarium – “Farmed clams, oysters and mussels…best choice.”
- Environmental Defense – “Farmed abalone, clams, mussels and oysters…best choices.”
Slide 28
U.S. Molluscan Aquaculture
Strengths
- Farmed mollusks are “ocean friendly”
- Mollusks have good nutritional profiles
- Mollusk prices are generally stable
Slide 29
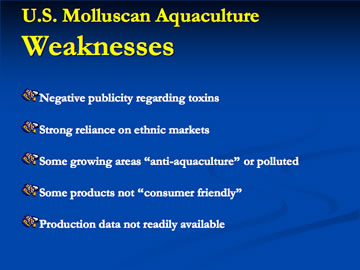
U.S. Molluscan Aquaculture
Weaknesses
- Negative publicity regarding toxins
- Strong reliance on ethnic markets
- Some growing areas “anti-aquaculture” or polluted
- Some products not “consumer friendly”
- Production data not readily available
Slide 30
U.S. Molluscan Aquaculture
Opportunities
- U.S. Seafood market is growing
Slide 31
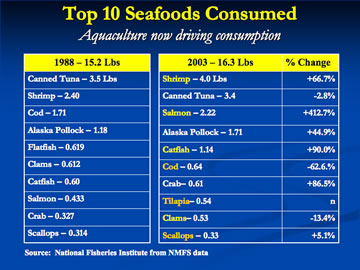
Top 10 Seafoods Consumed
Aquaculture now driving consumption
| 1988 – 15.2 Lbs |
|---|
| Canned Tuna – 3.51 Lbs |
| Shrimp – 2.40 |
| Cod – 1.71 |
| Alaska Pollock – 1.18 |
| Flatfish Flatfish – 0.619 |
| Clams – 0.612 |
| Catfish – 0.60 |
| Salmon – 0.433 |
| Crab – 0.327 |
| 2003 – 16.3 Lbs | % Change |
|---|---|
| Shrimp – 4.0 Lbs | +66.7% |
| Canned Tuna – 3.4 | -2.8% |
| Salmon – 2.22 | +412.7% |
| Alaska Pollock – 1.71 | +44.9% |
| Catfish – 1.14 | +90.0% |
| Cod – 0.64 | -62.6.% |
| Crab– 0.61 | +86.5% |
| Tilapia– 0.54 | NC |
| Clams– 0.53 | -13.4% |
| Scallops – 0.33 | +5.1% |
Source: National Fisheries Institute from NMFS data
Slide 32
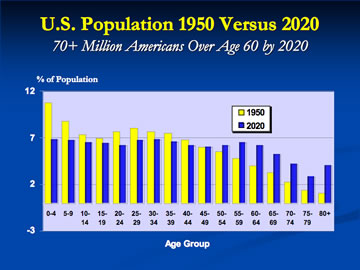
U.S. Population 1950 Versus 2020
70+ Million Americans Over Age 60 by 2020
Graph image: Showing the percent of population by age group from 1950 - 2020
Slide 33
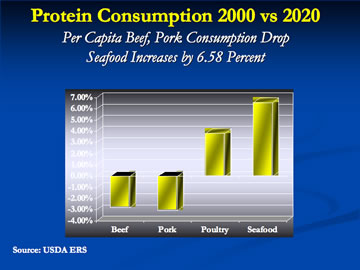
Protein Consumption 2000 vs 2020 Protein Consumption 2000 vs 2020
Per Capita Beef, Pork Consumption Drop
Seafood Increases by 6.58 Percent
Graph image: Showing the percent of drop of meat vs increase of seafood consumption
Source: USDA ERS
Slide 34
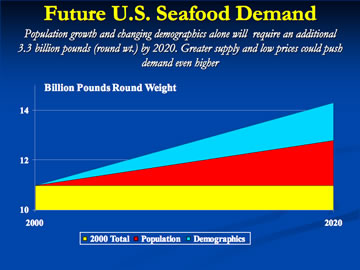
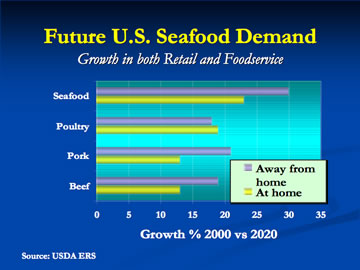
Future U.S. Seafood Demand
Population growth and changing demographics alone will require an additional 3.3 billion pounds (round wt.) by 2020. Greater supply and low prices could push demand even higher
Graph image: Showing the demand for seafood by 2020
Slide 35
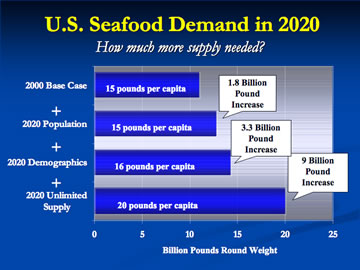
U.S. Seafood Demand in 2020 U.S. Seafood Demand in 2020
How much more supply needed?
Graph image: Showing the demand for seafood by 2020 will be 9 billion pounds increase.
Slide 36
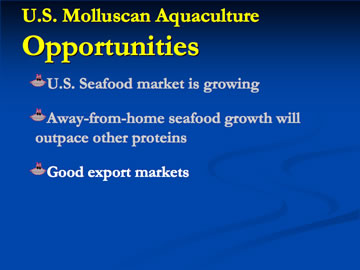
U.S. Molluscan Aquaculture
Opportunities
- U.S. Seafood market is growing
- Away-from-home seafood growth will outpace other proteins
Slide 37
Future U.S. Seafood Demand
Growth in both Retail and Foodservice
Graph image: Showing the growth percentage of 2000 vs 2020 in at home and away from home demand. Source: USDA ERS
Slide 38
U.S. Molluscan Aquaculture
Opportunities
- U.S. Seafood market is growing
- Away-from-home seafood growth will outpace other proteins
- Good export markets
Slide 39
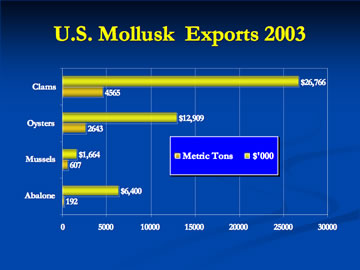
U.S. Mollusk Exports 2003
Graph image: Showing the export by metric ton of clams, oysters, mussels, and abalone in 2003.
Slide 40
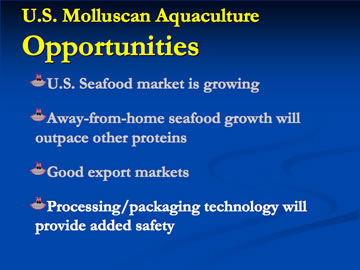
U.S. Molluscan Aquaculture
Opportunities
- U.S. Seafood market is growing
- Away-from-home seafood growth will outpace other proteins
- Good export markets
- Processing/packaging technology will provide added safety
Slide 41
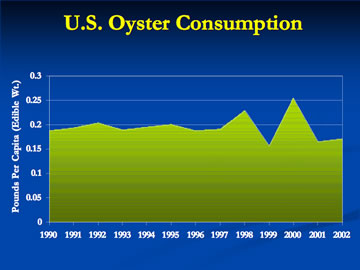
U.S. Oyster Consumption
Graph image: Showing the consumption by pounds per capita of oysters from 1990 to 2002.
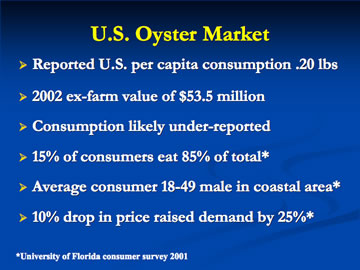
Slide 42
U.S. Oyster Market
- Reported U.S. per capita consumption .20 lbs
- 2002 ex-farm value of $53.5 million
- Consumption likely under-reported
- 15% of consumers eat 85% of total*
- Average consumer 18-49 male in coastal area*
- 10% drop in price raised demand by 25%*
*University of Florida consumer survey 2001
Slide 43
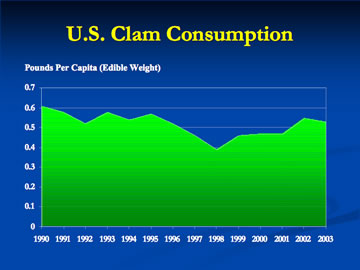
U.S. Clam Consumption
Graph image: Showing the consumption by pounds per capita of clams from 1990 to 2002.
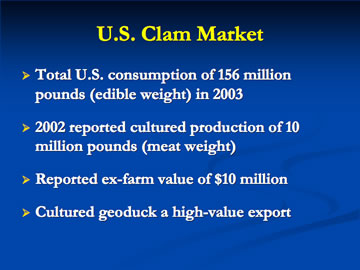
Slide 44
U.S. Clam Market
- Total U.S. consumption of 156 million pounds (edible weight) in 2003
- 2002 reported cultured production of 10 million pounds (meat weight)
- Reported ex-farm value of $10 million
- Cultured geoduck a high-value export
Slide 45
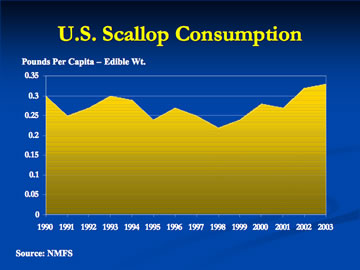
U.S. Scallop Consumption
Graph image: Showing the consumption by pounds per capita of scallops from 1990 to 2003. Source: NMFS
Slide 46
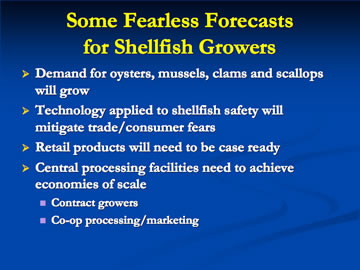
Some Fearless Forecasts for Shellfish Growers for Shellfish Growers
- Demand for oysters, mussels, clams and scallops will grow
- Technology applied to shellfish safety will Technology applied to shellfish safety will mitigate trade/consumer fears
- Retail products will need to be case ready
- Central processing facilities need to achieve economies of scale
- Contract growers
- Co-op processing/marketing
Slide 47
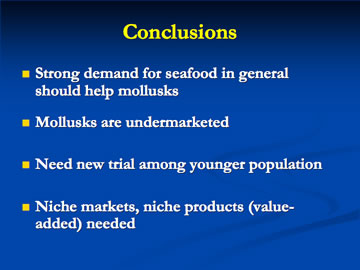
Conclusions
- Strong demand for seafood in general Strong demand for seafood in general should help mollusks
- Mollusks are undermarketed
- Need new trial among younger population
- Niche markets, niche products (value added) needed
Slide 48
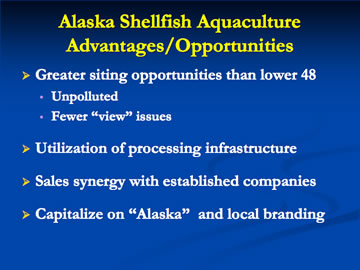
Alaska Shellfish Aquaculture
Advantages/Opportunities
- Greater siting opportunities than lower 48
- Unpolluted
- Fewer “view” issues
- Utilization of processing infrastructure
- Sales synergy with established companies
- Capitalize on “Alaska” and local branding
Slide 49
Alaska Shellfish Aquaculture
Advantages/Opportunities
- Development of contract growing, co-op or integrated models
- Small-scale “family” businesses
- Become world leader in red crab culture
- Proximity to Asia via air cargo
Slide 50
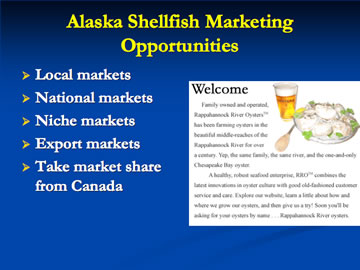
Alaska Shellfish Marketing
Opportunities
- Local markets
- National markets
- Niche markets
- Export markets
- Take market share from Canada
Image: Depicting a welcome message from a company or resturant
Slide 51
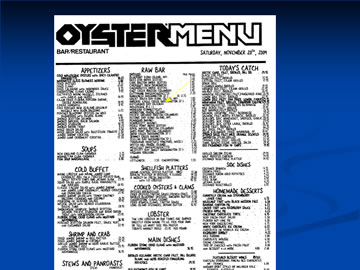
Image: Showing a oyster resturant menu
Slide 52
Image: Showing a oyster resturant sign
Slide 53
Market Studies on the Net
- New Brunswick Oyster Aquaculture Industry Market Study - no longer available on the net
- Marketing Opportunities for Pacific Oysters – PCSGA Study - no longer available on the net
- Clams Market Research Focus Group Report - no longer available on the net
Slide 54
Thank you