

Student success
Candidate data summaries
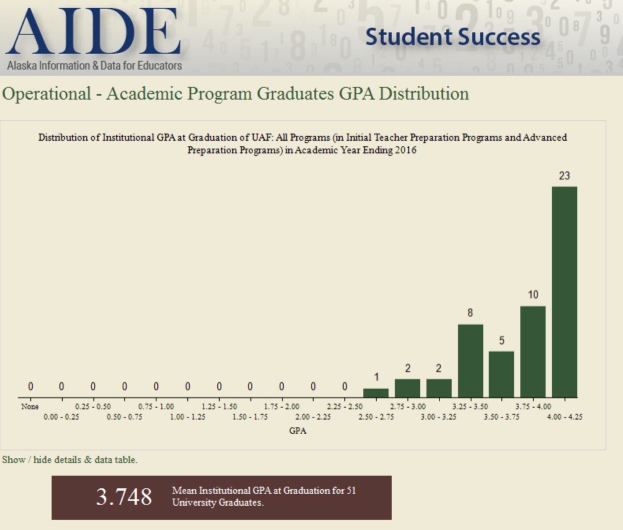
Distribution of institutional GPA at graduation of UAF: All programs (in initial teacher preparation programs and advanced preparation programs) in academic year ending 2016
Mean institutional GPA at graduation for 51 university graduation: 3.748
| GPA | Number of students |
|---|---|
| None | 0 |
| 0.00-0.25 | 0 |
| 0.25-0.50 | 0 |
| 0.50-0.75 | 0 |
| 0.75-1.00 | 0 |
| 1.00-1.25 | 0 |
| 1.25-1.50 | 0 |
| 1.50-1.75 | 0 |
| 1.75-2.00 | 0 |
| 2.00-2.25 | 0 |
| 2.25-2.50 | 0 |
| 2.50-2.75 | 1 |
| 2.75-3.00 | 2 |
| 3.00-3.25 | 2 |
| 3.25-3.50 | 8 |
| 3.50-3.75 | 5 |
| 3.75-4.00 | 10 |
| 4.00-4.25 | 23 |
| # | Program | Graduates | Average GPA at graduation |
|---|---|---|---|
| 1 | Bachelor of Arts - Elementary Education | 11 | 3.42 |
| 2 | Bachelor of Arts - Secondary Education | 4 | |
| 3 | Bachelor of Music - Music Education - Music Education K-12 | 1 | |
| 4 | Graduate Licensure Program - Elementary Education - Initial Teacher Cert Program | 6 | 3.98 |
| 5 | Graduate Licensure Program - K-12 Art - Initial Teacher Cert Program | 1 | |
| 6 | Graduate Licensure Program - Post-Bacc K-12 Spec. Ed. Lic. Prg. - Initial Teacher Cert. Program | 1 | |
| 7 | Graduate Licensure Program - Secondary Education - Initial Teacher Cert Program | 9 | 3.87 |
| 8 | Undergrad Licensure Program - K-12 Art - Initial Teacher Cert Program | 1 | |
| 9 | Undergrad Licensure Program - Teach Cred-Sec Ed - Initial Teacher Cert Program | 3 |
| UAF initial & advanced completors cohort | Employment retention | ||
|---|---|---|---|
| Graduation year | First year | Second year | Third year |
| 2011 | 94.7% | 93.0% | 91.3% |
| 2012 | 85.1% | 83.0% | 93.3% |
| 2013 | 91.7% | 83.6% | |
| 2014 | 93.9% | ||